
Last Update: March 4, 2022

Activity 7: Determine Schedule Logic
Page Outline
Application 1 - Learn Determine Schedule Logic Workflow
Activity 7 Workflow Simulation - 15 minutes (jump to)
Schedule Logic Content Links (jump to)
Application 2 - Select Task Mode
Task Mode Simulation - 15 minutes (jump to)
Application 3 - Define Timing Constraints and Deadlines
Timing Constraints Simulation - 20 minutes (jump to)
Application 4 - Link Detail Tasks and Milestones (jump to)
Scheduling Engine Simulation - 20 minutes (jump to)
Linking Detail Tasks and Milestones Simulation - 10 minutes (jump to)
Application 5 - Analyze Critical Path - 20 minutes (jump to)
Debug Calculation Simulation - 5 minutes (jump to)
Network Diagram Simulation - 40 minutes (jump to)
Application 6 - Decrease Timeline - 20 minutes (jump to)
Application 7 - Create a Master Project and Link Between Projects (jump to)
Cross Project Links Simulation - 20 minutes (jump to)
Review of Best Practices (jump to)
Activity 7: Determine Schedule Logic Exam (jump to)
Simulation Files (jump to)
Process Bridge (jump to)

Learn Determine Schedule Logic Workflow
Review
Review and learn the Determine Schedule Logic workflow below.
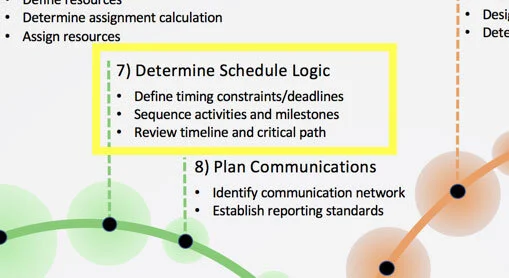
Figure 1. Activity 7 in Project MAP.

Note: This is Activity 7: Determine Schedule Logic in the Project MAP project lifecycle.
First, make sure you have selected the correct Task Mode for all of your summary tasks, detail tasks, and milestones. In general, Manually Scheduled tasks are a feature in Microsoft Project not recommended by many project management professionals, at least during the latter stages of planning and then of course during project execution. There is no project management principle or idea that suggests that a Manually Scheduled Task Mode is something you should consider using. The central reason for using project management software like Microsoft Project is for automatic calculations. All tasks should be scheduled by a scheduling engine that uses industry concepts and calculations in the scheduling engine. The appropriate Task Mode is Auto Scheduled.

Tip: Since a Manually Scheduled mode is available, feel free to temporarily use the feature when needed.
For Auto Scheduled tasks, the next logical step in the workflow is to select the appropriate Timing Constraints and Deadlines (if you are using deadlines). The primary reason to address Timing Constraints next in the workflow is that they have a higher priority over scheduling than links.
For instance, if a task is Must Start On a date, the task will be scheduled to start on that date regardless of links that might be pulling or pushing the task to start on a different date.
In addition, the type of Timing Constraint used often influences the type of link that is actually set.
The Deadline feature in MS Project is not a requirement for a correctly built schedule; this is an optional display type of feature with some scheduling functionality. For instance, a task past a deadline date will be marked as critical.
Last, after Linking detail tasks and milestones, analyze the Critical Path.

Journal
Can you think of a better workflow for Activity 7: Determine Schedule Logic? If yes, what is that workflow?

Activity 7 Workflow Simulation (15 minutes)
Open your MS Project Master Class Plan.mpp.
The first thing we are going to cover in this workflow is Task Mode. Right now, make sure all tasks are Automatically Scheduled. An easy way to check this is to expand the outline by showing all tasks and selecting the filter indicator on the Task Mode column name, the list below will note if there are any Manually Scheduled tasks. These column header filters (called AutoFilter) will identify all entries in that column and list them as a filter. If you have no Manually Scheduled task, the item will not be listed as a filter.
Don’t see the AutoFilter in the column headers? In Options AutoFilter can be turned on for new projects, to turn on AutoFilter for an active project, on the Ribbon select View / Data Group / Filter / Display AutoFilter.
There are two Task Modes. Manually Scheduled is rarely used, although you might discover some uses after a solid look.

Warning: If you have any Manually Scheduled tasks that are in a collapsed portion of the outline, they will not show in the header filter. When performing certain functions such as filtering, or reporting or searching, if the data is in a collapsed portion of the outline it may not be visible. Get in the habit of expanding the outing when performing certain activities or functions.
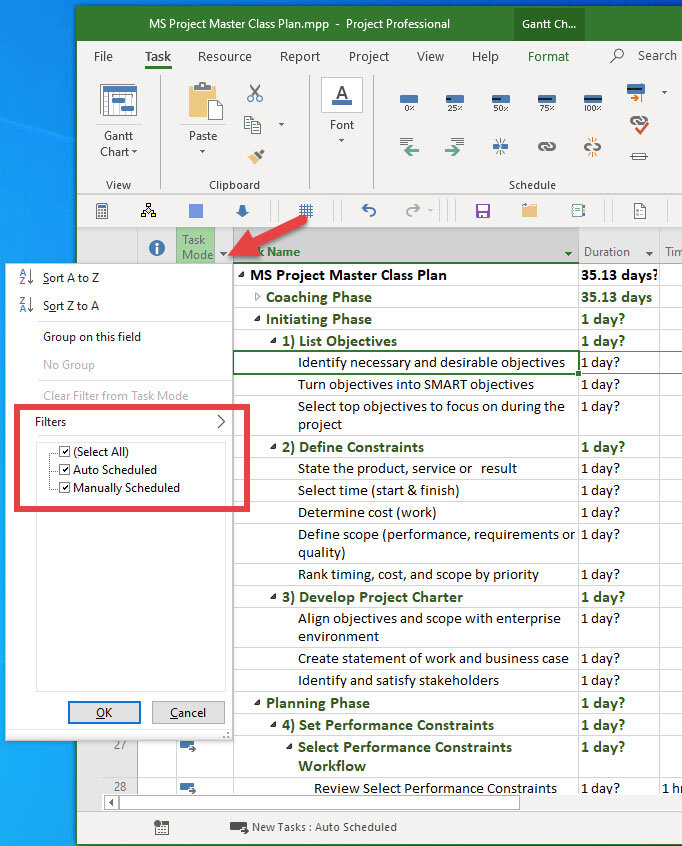
Figure 2. Column AutoFilter on data in the field.
Before linking tasks check your Timing Constraints. Simply, most tasks should be As Soon as Possible, but there are other constraints that you can use to get the scheduling result you might want. We will explore all of them. Scheduling tasks as As Late as Possible increases risk and too many date-related Timing Constraints fixes tasks in time defeat the primary reason for using Project Management software.
In your project, enter a task at the bottom of your outline called MS Project Master Class Completed and make it a milestone. Then double click on the task to open Task Information and click the Advanced tab.
This is one place to enter Deadlines and Constraint Types and a Constraint Date if appropriate. Deadlines and Constraint Types are similar, and you would rarely use both on a particular task, but for right now, enter the Deadline date for when you would like to finish this Master Class and then one day later, enter the date for a Must Finish On constraint. In the example below, the Deadline is 4/1 and the Constraint Date is 4/2.
When finished, notice the symbols representing those two dates in the taskbar pane of your window, and notice the symbol for each in the Indicator column.
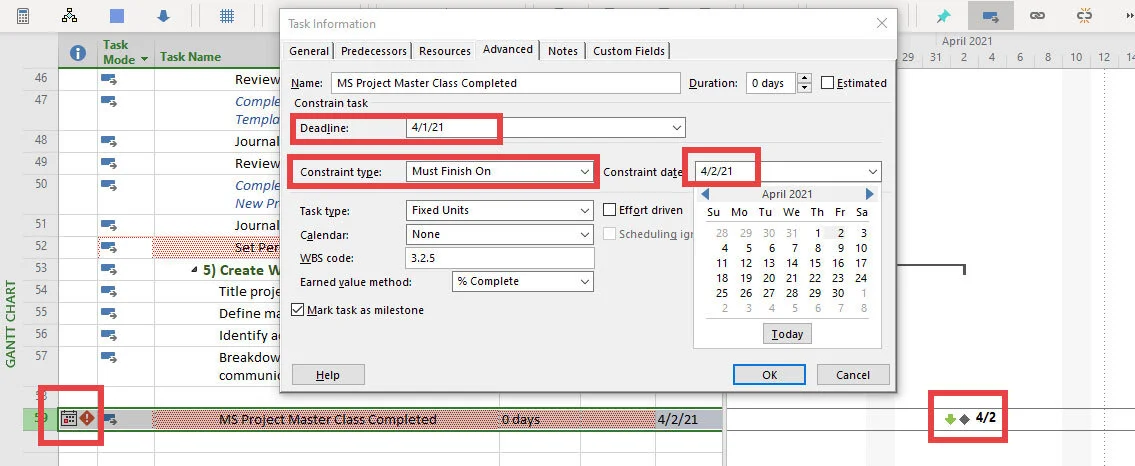
Figure 3. Timing constraints and deadlines.
After setting up Task Mode, and entering Deadlines and Timing Constraints, you are ready to link or sequence your detail tasks and milestones.
On your project, remove the deadline date and enter a Must Finish On date for your MS Project Master Class Completed milestone. Save your project.

Note: Every task has a Timing Constraint, but Deadlines are a feature that you are not obligated to use.
In your project select the three detail tasks under Select Performance Constraints Workflow, and then under the Task tab, select the Link command to link them together. The default link in MS Project is a Finish-to-Start link or dependency with zero lead or lag.
Once all of your detail tasks and milestones are linked, you can now analyze the critical path.
In your project plan bring it up to date by completing the following:
Using the table of contents and the outline at the top of this page, enter the WBS for this Activity and enter Duration estimates.
Assign yourself to all of the detail tasks in your plan.
Link all of your detail tasks with the default dependency, Finish to Start with zero lead or lag. To link tasks between two summary tasks, select the predecessor task, hold the control key and select the successor and click the Link command to link them together.
Save your project.
Simulation Results
Through Activity 7: Determine Schedule Logic, this MS Project Master Class Plan should include:
All of the activities that you have entered are based on the outline for the Activity (Chapter in the MS Project Master Class Book) and the outline on this page and previous pages. Your WBS should be up to date.
Estimates of duration for each activity.
You should be assigned the appropriate amount of work you think it should take. (We will enter Actuals, how much time it actually took you at a later date.)
All of the detail tasks and milestones should be linked together with standard dependencies.
You should have a Must Finish On date for the MS Project Master Class Completed milestone.
You should have a record of the time you have spent on each activity to date.
From this point forward, as you update this project for a new Activity in the Master Book:
Create the WBS for the current Activity you are working on.
Enter your estimates which includes making resource assignments. Both duration and work should be as accurate as you can make them.
Link detail tasks and milestones. Attempt to use edits to links to schedule correctly vs. entering timing constraints.
As you work on each activity in the Master Book and Online, enter your time spent in the custom column.
On each new Activity you cover, you will continue to develop this project plan.

Figure 4. Selecting and then linking tasks using the Link command.
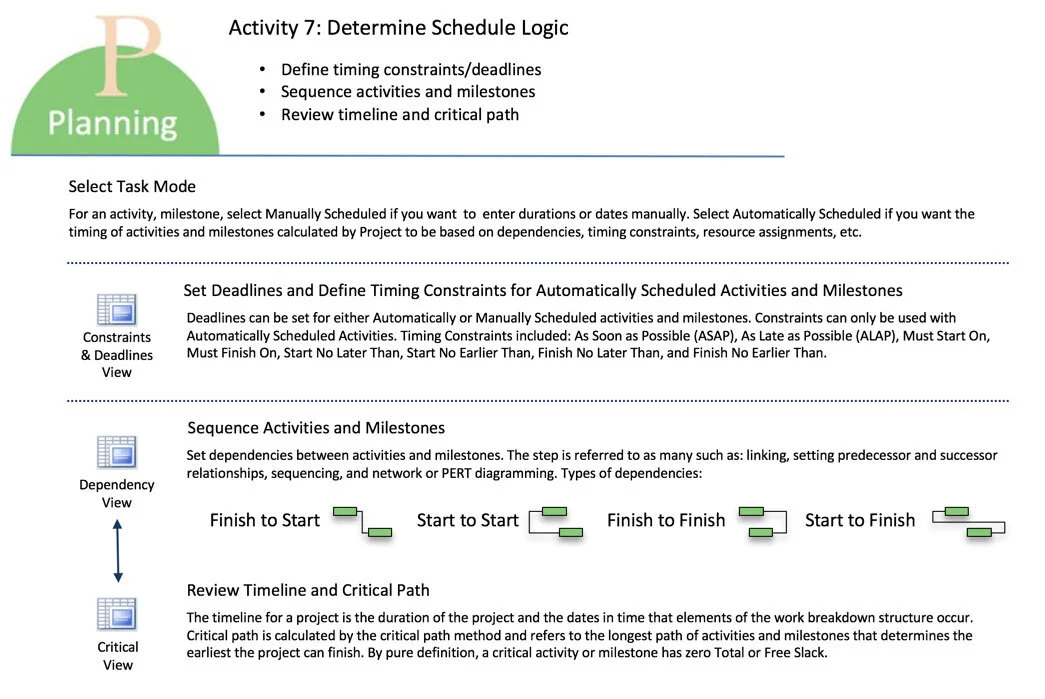
Figure 5. Activity 7: Determine Schedule Logic Workflow chart.

Download Workflow as PDF

Return to the Master Class Book and review the next section for this Activity.

Define Timing Constraints and Deadlines
Review
Read the Content Links above on Timing Constraints. (jump to)
Watch
Watch the video below on Timing Constraints (3:32 minutes). Using an example of scheduling a personal tax return. (Not that you would ever do that, this is just an example.) This video is designed to illustrate how Timing Constraints drive the schedule along with the types of links you use.
The video is sped up a bit to save viewing time.

Timing Constraints Simulation (20 minutes)

Download *.mpp file
To start this simulation, download Travel.mpp file using the icon above and open the file in Microsoft Project. Rename the file to 7 - 2 Travel.mpp. Make sure your global settings in Project Options are correct and that you are using Microsoft Project 2019.
Zoom Entire Project.
This plan, let’s say, is for your next business trip.

Tip: Likely you wouldn’t plan out a business trip in Microsoft Project. You might plan out that big European trip you are going on next summer. Consider using Microsoft Project in a variety of way on personal projects such as a trip, event like a wedding, kitchen remodel, residential move, or preparing for the PMP exam. Using Project on a variety of projects is one of the best ways to learn the software.
(As a side note, notice you can insert a rudimentary drawing in the taskbar area of a Gantt Chart view. Limited formatting options are available and a drawing can be attached to a task.)
(As a side note, notice you can insert a rudimentary drawing in the taskbar area of a Gantt Chart view. Limited formatting options are available and a drawing can be attached to a task.)
Figure 10. Go to the Format tab / Drawing command on the ribbon to add a drawing to the Gantt Chart view.
In this project, first change the formatting to show this date format: 1/28/09 12:33 PM. There are two ways to do this. One way is to change the date format in Options in the General category under Project view. By the way, if you made the date format change here, is this a local setting or a global setting? Is the change applied to just this project or to all open projects?
Another way to change the format for just this project is to change the date format of the active table. Making this change is just for the table that is applied to the view that is currently active in the project, it does not make the change for any other project, table or view that is open or applied.
To make the date change for just the table, on the ribbon select View / Tables command in the Data group, notice the Entry table is checked, More Tables… / Edit, and then make the selection in the Date format field.
In this plan, the Timing Constraint selected for the Flight Departs task is Must Start On, because for all practical reasons, even though a flight can be delayed and even legally leave a few minutes early, the departure time is non-negotiable. As travelers, we view the boarding time and departure times as fixed in time and we do whatever we need to do to be at the gate on time. During planning, this task would be ASAP for ALAP, but once the flight is purchased, it is now fixed.
You are currently scheduled to depart on 6/17 at 4 PM, and there are a few things you have to do before you head out to the airport, like take the dogs to the pet resort and pack. Let’s say that it typically takes you about 90 minutes to get to the airport, get past security, and then to your gate. Notice that there is a 30-minute dependency lag because you like to get to the gate with about 30 minutes to spare, or just about when boarding is scheduled to start.
All of the other tasks are scheduled As Late As Possible (ALAP) and Microsoft Project is pushing them towards the end date of the project. Holding them back from moving right up to the finish date are the dependencies or links.
Why are all of those tasks scheduled ALAP? Because you don’t want to go to the airport now, or tomorrow, you want to go to the airport 2 hours before departure.
And…. because you want Microsoft Project to do some of the scheduling for you, automatically, based on changes you might make.

Figure 11. Must Finish On Timing Constraint.
Let’s say a couple of days before your departure, your customer calls and tells you they are out with a bad cold and they need to reschedule to Monday the 5th of July.
You rebook your flight to Sunday, July 4th, at 3:20 PM, so you can be onsite first thing Monday the 5th.
Make that change in the Constraint Date field for the Flight Departs task and notice what happens. First, the entire schedule shifts toward that date because the tasks are ALAP. That is a good thing, that is one of the main reasons people use a project management tool like Microsoft Project, they want the schedule to automatically shift based on change. But in this case, the schedule isn’t calculated correctly because you are trying to schedule on a Sunday which is a non-working day in the project calendar.
There are several ways to make Sunday a workday, perhaps you decide the best and easiest way to remedy this problem for this particular project is to just make an exception for this July 4th date in the project calendar.

Note: An exception in the calendar is just that, an exception to what has been defined, this can be either working or nonworking exceptions.
To make this exception, on the ribbon go to the Project tab / Change Working Time command, scroll through the calendar, and select the date July 4, 2021. In the Name field below, type in Travel Day and press enter. Select the detail again and click on the Details button to edit. Then select the Working times: radio button and click OK to accept the default values. Click OK again and July 4th is now a working day and your travel day is now scheduled correctly.
To change the message in your graphic, just click in the cell and edit.

Figure 12. Working day exception to the project calendar.
Project Example
When I did a lot of Project Server deployments, part of a deployment project always included training for project managers, team members, resource managers and executives. Initially, the timing constraint on all training was ALAP, right up against the go-live date. However, training requires a lot of scheduling of participants, rooms, trainers, and equipment, so at some point in the deployment schedule, training would always become Must Finish on a date. As everyone in the training business knows, come hell or high water, as an instructor you make it to training on time.

Once at the Defense Logistics Agency in Columbus (DLA provides supplies to the military and supports their acquisition of weapons, fuel, repair parts, and other materials), I trained a lot of project managers on the first project management software available for the PC but the DLA didn’t actually have the software yet. In fact, there was a snag in procurement and they didn’t get the software for another six months. By then everyone forgot what they had learned about the software, so we did the classes again. Training for most any kind of deployment is almost always an ALAP activity.
ALAP planning will increase risk so you have to be sure that it is tied to something tangible. In this case, the DLA should have made training a successor of procuring the software vs. scheduling the training up against a promised deliverable.
ASAP Timing Constraints always push towards the Schedule Start Date as selected or entered in Project Information.
However, there is a scheduling feature in the software that will schedule new tasks against the current date. This feature is useful on long projects, where scope has changed months after the project started and you are changing a section of your schedule.
(By default, new tasks are scheduled at the Project Start Date if you schedule from the Project Start. If you schedule from the Project Finish Date, a new task is scheduled against the Finish Date.)
You can schedule a new task against the Current Date, by going to File / Options / Schedule / Scheduling options for this project: / Auto scheduled tasks scheduled on: / select Current Date.

Warning: If you insert a new task against the Current Date rather than against the Project Start or Finish, the software places a Timing Constraint of Start No Earlier Than that current date.
The Current Date is based on the system clock by default, however, you can temporarily choose any date you want by changing the Current Date in Project Information.
Do the following:
Schedule new tasks against the Current Date. Note that this is a local setting.
Change the Current Date in Project Information to 7/4/21.
Enter a new task, give it 2 hours duration and notice that it is scheduled with a semi-fixed Timing Constraint of Start No Earlier Than the Current Date you just entered as the temporary Current Date. As the Current Date changes, that Timing Constraint will stay the same.
Save your project.
Simulation Results
Your project, 7 - 2 Travel.mpp, should look similar to the one in the next figure. The Must Start On date should be 7/4/21 at 3:20 PM. The green note in the Gantt Chart should show that. The A New Task should have a SNET constraint of 7/4/21.

Figure 13. Simulation results.
Memorize the Timing Constraints
From memory, be able to answer these question:
What are the eight types of Timing Constraints that are available for detail tasks and milestones?
What are the characteristics, or categories, of Timing Constraints and why are they so labeled?
What are the three types of Timing Constraints that can be applied to Summary Tasks?

Journal
Do you think it is true that this feature ties up more people in knots than any other? It seems intuitive to enter a start date for a task, yet that creates a semi-flexible Start No Earlier Than Timing Constraint. Enter the finish date and create a semi-flexible Finish No Earlier Than Timing Constraint.
What is the primary difference between Deadlines and Timing Constraints?
What are the eight types of Timing Constraints available for detail tasks and milestones?
What are Timing Constraints' characteristics or categories, and why are they so labeled?
What are the three types of Timing Constraints applied to Summary Tasks?
If you need to enter a date and time for a Timing Constraint, it is helpful to have a time display that shows both. What are the two ways to change the date display in Project?
How do you schedule new tasks against the Current Date? What happens to the Timing Constraint if you use this feature and insert a new task?

Best Practice
In general, with the exception of notes, don’t make any changes to summary tasks. Allow summary tasks to just reflect what is indented below them, rather than attempting to interact with indented tasks and milestones. This best practice will make it easier to work with and interpret changes to schedule.

If you are working with a coach, save and email them this file (7 - 2 Travel.mpp should look like Figure 13). If you are not working with a coach and you are planning to apply to either MS Project Master Class certificate, archive this completed simulation file so that you can submit it for review.

Return to the Master Class Book and review the next section for this Activity.
Content Links

All tasks (detail tasks, milestones, summary tasks and recurring tasks) except the project summary task (row zero) are either Manually Scheduled (are mostly scheduled by changes you make) or are Auto Scheduled (are not scheduled by just the changes you make, but by the rules of the scheduling engine and how you have applied these rules).
A Manually Scheduled timeline is similar to drawing a Gantt Chart by hand on a whiteboard. An Auto Scheduled timeline is the preferred Task Mode for an active project vs. a project in the early stages of planning.

Best Practice
Learn to use Auto Scheduled tasks. Don’t use Manually Scheduled tasks after the estimating phases of planning.

A Deadline is a visible date in Microsoft Project that is associated with a task. Deadlines do no impact the schedule. However, Negative Slack is calculated for a miss deadline date.
Set the deadline using the Deadline field. A visual of that deadline date is placed with that task in the Gantt Chart. The Indicators field will identify the status of the deadline date, letting you know, “This task goes past its deadline of (date).”
You can set a Deadline for all detail tasks (either Manually or Auto Scheduled), summary tasks and milestones.

Possibly the most important feature of Microsoft Project is the calculation of critical path, or Critical Path Method.
Critical Path
The longest path or sequence of project activities that control the earliest a project is expected to finish.
Traditionally, an activity on the critical path has no float or slack, meaning that if the activity is delayed it will delay the finish of the project.
Suppose, for example, that three people are each traveling different routes from point A to point B and would like to know the earliest they can meet together at point B. The person taking the longest path (on the critical path or the longest route) to point B determines the earliest possible time the three can meet together. If that same person takes one hour longer to get to point B than planned, the earliest meeting time is delayed by one hour.
Critical Path Method (CPM)
A simple mathematical method used to determine the duration of the project by calculating the possible paths of activities in a project schedule and identifying the longest path (critical path) in the schedule, or the earliest the project can be expected to finish given everything that must be accomplished.
The Critical Path Method also calculates the amount of float or slack for each activity and sequence or path; identifying how much an activity or sequence of activities can be delayed before delaying the finish of the project.
The Critical Path Method uses a forward pass and backward pass calculation to determine project duration and activity float or slack.

Best Practice
When attempting to shorten a schedule, focus on critical tasks; those tasks that are driving the duration of the project.

Behind the scenes of your timeline are an interactive set of features, or rules, that determine how tasks are scheduled. This set of features is often referred to as the scheduling engine.
A partial list of features already reviewed in this program include:
Project Start Date
Scheduling From the Project Start Date or Project Finish Date
Calendars
Schedule Selections in Options
Task Type (Fixed Duration, Fixed Units, Fixed Work) crossed by Effort Driven (Yes or No)
Resource Assignments
Additional features include:
Task Mode (Manually or Auto Scheduled)
Task Constraints
Links or Dependencies
Best Practice
Learn all of the rules associated with the scheduling Engine and the subsequent schedule behaviors. There is no shortcut and no other way to master Microsoft Project.

There are a variety of terms used to describe linking in Microsoft Project:
Linking
Setting dependencies
Sequencing deliverables
Network diagramming
Setting predecessor and successor relationships
There are four different types of links that can be created between tasks:
Finish to Start
Start to Start
Finish to Finish
Start to Finish
There are three basic ways to link tasks:
Selecting tasks and then clicking the Link command
Editing any of the many predecessor or successor fields
In the task bar pane or a calendar view, click, hold and drag the link command

Warning: Microsoft may routinely make changes to the scheduling engine. Upgrading to a new version or even applying an update can result in a schedule being calculated differently.

Best Practice
Only link detail tasks and milestones.
Make sure that every detail task and milestone has at least one predecessor and one successor.
If you have a Master Project, create and edit links the same way that you do in a typical project.
While in the Master Project, if you are linked to the source projects and have the permission to write back to the source projects, those changes to the source projects occur when you save the Master.
If you do not want to manage a Master Project, Close the Master after you have created your cross project links, don’t save the project, but when asked, save changes to the source projects.

Best Practice
Limit the number of external links you create. Numerous external links can be difficult to manage.
Avoid Circular Dependencies. Circular dependencies are defined as Dependency Loops. Dependency Loops are defined as Circular Dependencies.

A variety of Timing Constraints are only available for Auto Scheduled tasks. All Manually Scheduled tasks are As Soon as Possible (ASAP).
The most important thing to remember is that Timing Constraints have a higher priority on schedule than links. Unless you turn off that particular scheduling rule in Project Options. (Project Options / Schedule / Scheduling Options for this project / Tasks will always honor their constraint dates.)
There are eight Timing Constraints that can be applied to detail tasks and milestones.
Flexible
As Soon As Possible (ASAP) - Pushed toward the project start date
As Late As Possible (ALAP) - Pushed toward the project finish date
Semi-Flexible
Start No Earlier Than (SNET) a date - The task can be pushed out in time, but can not start earlier than a date you enter
Start No Later Than (SNLT) a date - The task can start earlier than scheduled, but can not start later than a date you enter
Finish No Earlier Than (FNET) a date - The task can finish later than scheduled, but can not finish earlier than a date you enter.
Finish No Later Than (FNLT) a date - The task can finish earlier than scheduled, but can not finish later than a date you enter
Inflexible or Fixed
Must Start On (MSO) a date - The task must start on a date you enter
Must Finish On (MFO) a date - The task must finish on a date you enter
Three Timing Constraints are available for Summary Tasks:
As Soon As Possible
Start No Earlier Than a date
Finish No Later Than a date

Best Practice
When you first execute a schedule, most of your detail tasks, milestones and summary tasks should be ASAP or ALAP. During execution, the dates associated with tasks often become more fixed in time.
Do not use any other Timing Constraint for a summary task except ASAP.

Ideally, you can have a pure critical path in your project. Part of the idea around optimizing your project is to keep working it until you do.
Project Example
In practice, I have seen very few pure critical paths in Microsoft Project. It takes a certain type of project and a high skill set to actually create one.
I was working at the Secret Service headquarters with some people that plan communication projects for Presidential trips. These are trips for the President to meet with a head of state, attend an event like the Olympics or ballgame, or to go to a meeting like the G8 summit.
The US Secret Service uses a lot of contractors for these types of projects and one individual brought in a project printed out on a plotter that was a Time Scale Network Diagram about 5ft high by 12ft long. He rolled out the diagram on the conference room table and said, “Tell me what you think of this.” My first response after immediately seeing a critical path weaving clearly through hundreds of tasks was to say, “I can’t tell you if the data is valid, but this is a beautiful thing. Whoever create this is a master scheduler!”
Even if you don’t have a “beautiful critical path” clearly weaving through your schedule, you will still have critical tasks and this information is invaluable for managing your project.
One reason it is hard to create a pure critical path is that Microsoft redefines what is marked as critical. A detail task or milestone is “critical” in Microsoft Project if it meets any of these conditions:
It has zero slack or what some people call float. This can be redefined in Project to be, for example, any task with zero to five working days of slack.
Figure 6. Click on this image to view
It has either a MSO or MFO Timing Constraint
It has an ALAP Timing Constraint when the project is scheduled from a start date as selected in Project Information
It has a finish date that is the same as, or it is past its deadline date


Task Mode Simulation (15 minutes)

Download *.mpp file
To start this simulation, download the Task Mode.mpp file by using the icon above and open it in Microsoft Project. Rename the file to 7 - 1 Task Mode.mpp. Make sure your global settings in Project Options are correct and that you are using Microsoft Project 2019.
Note the following:
The Task Mode for row zero, or what is also called the Project Summary Task, is Auto Scheduled. This can not be changed, it is always Auto Scheduled.
Summary 1, and Task 1, 2 and 3 are Manually Scheduled tasks. If you are using Manually Scheduled during the early rounds of estimating, notice that you can type in any text in the duration, start and finish fields. If you type in an actual duration or date, the task responds to those types of entries.
Change Summary 1 to Auto Scheduled. What happens? In Auto mode, it calculates what it can. It moves to the first date in time. The rollup on the summary level, the timespan of the tasks indented below, is now five working days.

Figure 7. Auto Scheduled summary task with Manually Scheduled tasks.
Change Summary 1 back to Manually Scheduled. Change the Mode by clicking the Undo on the toolbar. Then click the Redo button and notice the behavior. Then manually select Manually Schedule for Summary 1. The software keeps the last information calculated under Auto mode and puts it back to operating in manual mode. The thing to remember when switching between modes is that Project takes into account the current set of data and attempts to apply the Mode as well as it can.
Change Task 2 duration to 10 days. The rollup on the summary level is not calculated because it is manually scheduled.
Link Task 2 and 3 in a standard dependency. Dates are now calculated for Task 3. Manually Scheduled tasks do follow some rules if you want them to. In this case, a selection in Options is selected to adjust the dates for Manually Scheduled tasks when editing links. This selection in Options is shown in the figure below.

Figure 8. Update Manually Scheduled tasks when editing links.
Summary 2 and Tasks 4, 5 and 6 are Auto Scheduled. Change Task 4 to 10 days duration. A new finish date is calculated for the task and its summary task and the rollup up of duration on the summary task now spans 10 working days.

Note: Unlike the rollup on the summary level for fields such as work and cost, the rollup for duration is not summative, the rollup up duration summarizes the entire time span of the tasks indented below it.
Change Summary 2 to Manually Calculated and change the duration of Task 5 to 12 days. The rollup on the summary level is not calculated.
Change Summary 2 back to Auto Scheduled. Notice that the timespan is rolled up to the summary, not the sum of all of the durations of the tasks indented below.
Make sure the duration of Task 4 is 10 days, change Task 5 to 2 weeks, and then change the duration of Task 6 to 80 hours. Enter a new Auto Scheduled Task #7 at the same level after Task 6 and enter a duration of 4,800 minutes. Enter a new Auto Scheduled Task #8 at the same level after Task 7 and enter a duration of .5 months. These tasks are all of the same duration, so the rollup is still 10 days.
What would the duration of Summary 2 be if you linked Task 4 - 8? Try it, were you right?
You should be able to explain why all four of those tasks, 4, 5, 6, 7, and 8, are the same duration. If you are not crystal clear on why those tasks have the same duration, review the Project Calendar and Calendar Options for this project: in the Schedule category in Options.
Save this project.
Simulation Results
The file 7 - 1 Task Mode.mpp should have the same durations as the figure below. The first four tasks are manually scheduled, the next nine are auto-scheduled. The durations for Summary 2 and the indented tasks should appear as below.

Figure 9. Simulation results, rollup of duration on the summary level.

Journal
Microsoft describes the best Use of Manually Schedule Task Mode as:
Best Uses: You can manually schedule or automatically schedule all tasks throughout the life of a project. For example, during the proposal phase, you might want to schedule all tasks in your project manually and then switch to automatic scheduling after the proposal has been accepted and the project is about to start. You can manually schedule certain tasks while all other tasks are automatically scheduled.
Explain why you might disagree with this perspective.
If there is ever use for Manually Scheduled Task Mode, what would that be?
Can you change the default setting for Task Mode to Auto Scheduled?
Can you set Deadlines and Timing Constraints for Manually Scheduled Tasks?
Can you set Links for Manually Scheduled Tasks?
What happens when you change a Manually Scheduled task to Auto Scheduled?
Can the Project Summary task be Manually Scheduled?
What is the project management software industry’s perspective on Manually Scheduled tasks?

Best Practice
If you are using Manually Scheduled tasks you are missing the primary point of using project management software that has a scheduling engine. All tasks should be Auto Scheduled at this point in the planning process.

If you are working with a coach, save and email them this file (7 - 1 Task Mode.mpp should look like Figure 9). If you are not working with a coach and you are planning to apply to either MS Project Master Class certificate, archive this completed simulation file so that you can submit it for review.

Return to the Master Class Book and review the next section for this Activity.

Link Detail Tasks and Milestones
Review
Read the Content Link above on Link (Dependency) Types and Ways to Link, and the Content Link on the Scheduling Engine. (jump to)
Watch
Watch the video below on “The five ways of setting and editing links in Microsoft Project” (7:24 minutes). During the practice section, you will create links in all of these different ways.

Scheduling Engine Simulation (20 minutes)

Download *.mpp file
To start this simulation, download the Dataco - Scheduling Engine.mpp file using the download icon above and open the file in Microsoft Project. Rename the project to 7 - 3 Dataco - Scheduling Engine.mpp. Make sure your global settings in Project Options are correct and that you are using Microsoft Project 2019.
This simulation is a review of the Scheduling Engine rules and the subsequent impact of each feature’s rules on the schedule. A good way of thinking about Microsoft Project is that you build a project plan in the software and the software’s features have certain rules that need to be understood to understand how tasks are being scheduled. In addition, there are features that are available if needed, that may or may not be based on project management thinking.
It is a bit like driving an automobile, the purpose of a car is to take a trip and the car has all kinds of features to help you do that safely and comfortably. In many ways all automobiles are alike. Traditional Project Management software all pretty much works the same way too. They use the same tools and techniques and they follow pretty much the same sets of scheduling rules.
When driving an automobile there are the “rules of the road,” that we have to learn and of course, different manufacturers approach this idea of “safely and comfortably” in distinct ways. With today’s cars, there is a common set of safety features, such as safety belts, airbags, antilock brakes, backup cameras and traction control, but more and more automobiles are becoming distinctive in the way safety features and other characteristics of makes and models are designed and used. The Washington Post described Tesla as less of a traditional automobile and more of an iPhone on wheels.
Project Example

I was helping a group at Texas A&M University in Doha, Qatar, deploy Project Server. I knew that Doha likely had the most concentrated per capita luxury cars in the world and I envisioned taking a luxury car out to the desert, pointing the car in the direction of Saudia Arabia, and having a type of Top Gear experience. My customer said, “No, you can’t have a car here, you will get killed in one of our roundabouts, you have to learn how to use them, you can’t just go figure it out. Second, if you do survive, the roads are all video and camera monitored. When you get to the airport to leave, there will be a list of traffic infractions and you will have to pay them or you can’t leave. We have a driver for you.”
Sure enough, on the way to campus each day and not far past the headquarters for Al Jazeera, my driver would approach the worst roundabout in the city where hundreds of cars were converging from five or six directions at pretty good speeds. Each time we made it through I would say, “I can’t believe we got through that.” The driver even seemed nervous to me, so I asked him, “How long have you been driving for Education City?” “Five years,” he replied. “How many times have you gone through this roundabout?” “Oh, many times each day.”
Later in the week, I remember saying to the group I was working with, “Project Server is easy to learn, but you can’t just expect your project managers to get into the driver’s seat and learn Microsoft Project on their own, it will take too long and they likely won’t. They need to be taught how the scheduling engine works at minimum and they need to follow some best practices. Even if they do sort of figure it out on their own, all of the project plans are going to look different. If you want everyone on the same page, if you want meaning across projects, you have to teach them.”
If you drive a Mazda, perhaps you are familiar with Inba Ittai, an expression of the symbiotic relationship and bond developed over time by a horse and rider. “The horse and rider as one.” Mazda attempts to design cars to feel like a natural extension of your being, cars that are more than safe and comfortable, cars that are enjoyable to drive. Mazda claims that their “human-centric design" philosophy is about making cars that adapt to the driver, not forcing the driver to adapt to their car. I was hiking the Speyside Way in Scotland and one afternoon I called an Uber to take me from the trail to one of my favorite Scotch whisky distilleries for the afternoon. The driver picked me up in her shiny new MazdaSpeed3 and told me how much she enjoyed driving the car. We spent the trip talking about those design features that create that feeling.
You will have to decide if Microsoft Project is enjoyable to use like it is to drive certain cars, but for now, what are those scheduling rules we need to know about in Microsoft Project?
When you opened this file, 7 - 3 Dataco - Scheduling Engine.mpp, a scheduling message appeared as shown in the figure below. If you did not get a scheduling message, turn on scheduling messages. Scheduling messages are a Global setting turned on or off in Options. (File / Options / Schedule / Schedule / Show scheduling messages.) Exit the project and open it again and you will see this scheduling message.
Usually, but not in this particular case, these messages can be useful in helping you identify a problem in the schedule and which tasks are involved in this scheduling problem. As it turns out, this particular scheduling message is about as helpful as the check engine light, and it makes a couple of faulty suggestions. It would be more helpful for the message to say:
There is a conflict with the Timing Constraint for task number 17 Project Finish and at least one predecessors for the task. The Timing Constraint for the task says it Must Finish On 5/25/21 but the predecessor wants to push the task to finish on 5/28/21, three working days later.
If this is acceptable, remove the MFO constraint.
If this is not acceptable, address the schedule of predecessors to this task.
Figure 14. Scheduling message.

Figure 15. Negative Total Slack.
The scheduling message above does point us in the right direction. In the figure directly above, we can easily see that the schedule is being pushed out past the Must Finish On Timing Constraint on the last task. There are three days of negative slack, meaning that the schedule needs to be brought in by three working days to be completed on time.
These are the primary features and/or scheduling rules to review, and or check for a particular project.
Calculation
Check to make sure Calculation is on. If not, changes will not be calculated when data is entered or changed. (Options / Schedule category / Calculation / Calculate project after each edit: / On.)
There are a couple of practical reasons to turn Calculation off. One reason is performance; on very large schedules or when loading Master Projects with a lot of large projects inserted, there might be an irritating wait time for the schedule to calculate when entering updates. If you have Calculation off, you can enter data then calculate when you want by pressing the F9 key.
Give it a try, turn off Calculate project after each edit. Enter two new tasks at the end of the task outline and give both a duration of 5 days and then link them together. There was a minor calculation when duration was entered, but the tasks are just hanging there ready to be calculated. Press F9 to calculate.
Turn auto calculation back on.
Project Information (Start Date, Scheduling From and the Project Calendar)
Open Project Information (Project tab / Project Information command). Check the Start Date, Scheduling From selection and what project Calendar is being used for the project.
Note the schedule starts on 1/1/2021, and that the Project Start milestone in the schedule does start on the 1st. This milestone is a predecessor (Finish to Start type with zero lead or lag), but the next task #3 Finalize Course Design is not scheduled to start until the 4th. Why?
Explain why in the Notes field for the task Finalize Course Design.
Calendars
Open Change Working Time (Project tab / Change Working Time command) and note the exceptions and how a workweek and work day are defined for the Standard Calendar. Click the Options button and note that the selections are congruent with how the calendar is defined.
Click Cancel, and in the For calendar: field, select the 7 Day - No Holidays calendar and review the definition of that calendar and then click OK or Cancel.
The Standard Calendar is determining the working and non-working days for the schedule. The project is 104 working days as defined by the Standard calendar, not calendar days. Convert that number to weeks (File tab / Options / Schedule category / Scheduling options for this project: ). Change the Duration is entered in: to Months.
Remember the five scheduling rules for calendars? The question has been on the last three review exams.

Note: Every duration in Microsoft Project is in working time as defined by the calendar being used. If a task was 1 year in duration, the number of days would be the number of working days defined for that year.
The project is almost 4 months and three weeks in calendar time. If you were reporting on this project,104 days might be interpreted to be calendar time vs. working time. Saying the project is a week short of 5 months in duration is a little easier for people to understand.
Observe the Indicators for task #12, Shoot Final Video. The indicators tell us that there are task notes and the task is using the 7 Day - No Holidays calendar.
Check the calendar selections for this task. Double click on task #12. Select the Advanced tab in the Task Information dialog box, note the calendar selected and that the Scheduling ignores resource calendars is checked. Notice that the task is running five days, straight through the weekend, even though the project calendar has a five-day workweek and the resource assigned to the task is likely using a different calendar than the 7 Day - No Holidays calendar.
Check the resources calendar. In the bottom Task Form view, apply the Work theme and then double click on the Production and Manufacturing Manager assigned to the task. In the Resource Information dialog box, click the Change Working Time…button and note that this resource is using the Standard calendar. Make a note in Task Notes, to be sure to get a commitment from the manager to work this weekend. Make the note stand out so bold it in red.
Timing Constraints
Most tasks in this schedule have ASAP timing constraints, which means they are being pushed toward the start of the project. The Project Finish task is Must Finish On, 5/25/21, and #7, Produce Scratch Audio is ALAP. Change #7 to ASAP and notice the task is no longer critical, or on the critical path. Doing Produce Scratch Audio as late as possible should increase the performance on this task, although making it critical increases some risk, and right now in this project most of the tasks are critical.
Links
Most tasks in this schedule have standard Finish to Start links with zero lead or lag. Identify the two tasks with different types of links. Highlight those tasks in green.
Effort Driven Scheduling
Look at the Project Finish task and the information in the Total Slack column for that task. We will review this field and related fields in the next section on the Critical Path Method. For right now, negative 3 days means the schedule needs to be brought in by three working days so that this task can meet the Must Finish On date of 5/25/21.
Let’s say #6 Develop Draft Material is one of those types of tasks that can be shortened by assigning additional resources.
Select task #6 and note in the Task Form view at the bottom of the split window, that the Task Type for task #6, is Fixed Work. Therefore, assigning an additional resource will decrease the duration of the task proportionately.
In the bottom Task Form view, assign the Instructional Designer to the task. The task duration is cut by almost a third, the last task no longer has negative slack (float) and the critical path is much more realistic and most tasks have more than a week of slack.
Resource Leveling
We haven’t looked at this feature yet, but it is always important to evaluate Resource Leveling when reviewing the scheduling engine settings for a schedule.
Resource Leveling is a set of features that will delay tasks around resource availability.
First, check to see if the leveling calculations are automatically being applied. (Resource tab / Leveling Options command). Leveling calculations should be Manual.
If you are uncertain if the schedule has been leveled in the past, you can clear leveling for the entire project (Resource tab / Clear Leveling command). Or, you can insert the column Leveling Delay to check if there are any tasks currently leveled.
Save the project. Consider compiling your own list of things to check to make sure your schedule is calculating correctly.
Simulation Results
The file, 7 - 3 Dataco - Scheduling Engine.mpp, should look similar to the one in the figure below.
The duration of the project should be around 4.5-6 months.
The two tasks with other than standard dependencies should be highlighted in green.
#7 should be ASAP
#6 should have the Instructional Designer assigned.
#12 should have notes in bold red.
All tasks should have some slack.

Figure 16. Results from the scheduling engine simulation.
Project Example
When someone sends me a schedule where the calculations don’t make sense, these are the first things I check.
That calculation is turned on.
The project calendar and the corresponding selections in Options match.
I review any task calendars.
I check to see if resource leveling is on, or that tasks have been delayed by leveling.
I check to see if there are any Manually Scheduled tasks.
90% of the time I will find the problem within a couple of minutes after checking these areas.
I had a customer that analyzed the schedules for large capital projects that had gone badly and eventually reached the courts to determine liability. To help establish liability, the customer would assess the selections made in the software related to the scheduling engine. If it was determined that the schedule management team was using the scheduling engine inappropriately and that the schedule was calculated incorrectly, they might testify that the scheduling team was liable.
There are a few tools on the market that analyze schedules. One of my favorite tools is Project Analyzer by Steelray.

One tool I currently use will analyze a project based on the DCMA 14-Point Assessment, developed by the Defense Contract Management Agency and other criteria. The product is called Schedule Inspector by Barbecana. This tool works well, is easy to use and priced well. See: https://www.barbecana.com/schedule-inspector/.

Linking Detail Tasks and Milestones (10 minutes)

Download *.mpp file
To start this simulation, download the Types of Links.mpp file using the Download icon above and open it in Microsoft Project. Rename the file to 7 - 4 Types of Links.mpp. Make sure your global settings in Project Options are correct and that you are using Microsoft Project 2019.
In this simulation, we will look at the various ways to set and edit links.
Select the Start task and Task 1, right-click, and link them together using the Link command on the little toolbar at the top. You can also select tasks and use the Link command in the Schedule group under the Task tab.
Double click on Task 2, go to the Predecessors tab and make Task 1 a predecessor with a Finish to Start type with 2 days lead.

Note: Once a type of link is selected, lead or lag can be added. It is lag if the task is pushed toward the finish date, or it is lead, bringing the task closer to the start date. In this case, enter -2 days in the lag field. Those negative 2 days brings the task closer to the start date.
Split the window (View / check Details). In the Task Form view below, right-click and apply the Predecessors & Successors them or detail. Select Task 3 in the top view. Using the form in the bottom view, change the dependency and Make Task 3 a Start to Start successor of Task 2, with 3 days lag. Task 3 will start 3 days after Task 2 starts.
Make Task 3 a predecessor of Task 4 by dragging the taskbars. Move the cursor over the Task 3 taskbar and notice the move tool with the four arrows pointing in four directions. Click, hold and then move the cursor up or down, the move tool turns into the link tool. Drag the link tool from the Task 3 taskbar to the Task 4 taskbar to link them together in a standard link or dependency.
Double click on the link line between Task 3 and Task 4 to open the Task Dependency dialog box. Add 25% lead to the Finish to Start type of relationship.
Make Task 4 a predecessor of Finish by entering 5 in the Predecessor column for the Finish milestone.
Save the project
In this example, Task 2 does not have a successor, but the best practice is that every detail task should have at least one successor, so it does need to finish before the end of the project. Make it a predecessor to Finish. Do this by selecting Task 2, pressing the Control key and selecting the Finish task, right clicking, and then clicking the Link command.
This is worth mentioning at this point. There is a auto link feature in Project that links inserted or moved tasks to the tasks above and below that placement.
To turn on Autolink on or off, go to File on the ribbon / Options / Schedule / Scheduling options in this project: / check or uncheck Autolink inserted or moved tasks.
Save the project.
We just covered nine ways to set and edit links. Unlike many features in most software, knowing all of the ways to accomplish something with an Office product isn’t always important or useful. With linking in Microsoft Project it is helpful to know all of the ways, so you can edit them wherever you happen to be. Linking, making adjustments to links, is an ongoing activity.
Simulation Results
This file, 7 - 4 Types of Links.mpp, should have the same links as those in the figure below.
Figure 17. Simulation results, different types of links.
Memorize
There are four types of links, but the Start to Finish type is so rarely used, there isn’t much of a reason to give it much thought.
Memorize the three primary types of links:
Finish to Start (FS) This is the default dependency or link and is called the standard dependency
Start to Start (SS)
Finish to Finish (FF)
Also remember, when lead is added to a dependency, it brings the successor in closer to the start date. Lag is moving the successor out in time.
In the example in the graphic, there is lag in the Start to Start relationship between Task 3 and Task 4. There is also lag in the Finish to Finish relationship between Task 5 and Task 6.
There is no lead field in Microsoft Project, only Lag field. The lag number, negative or positive, determines if it is lead or lag.
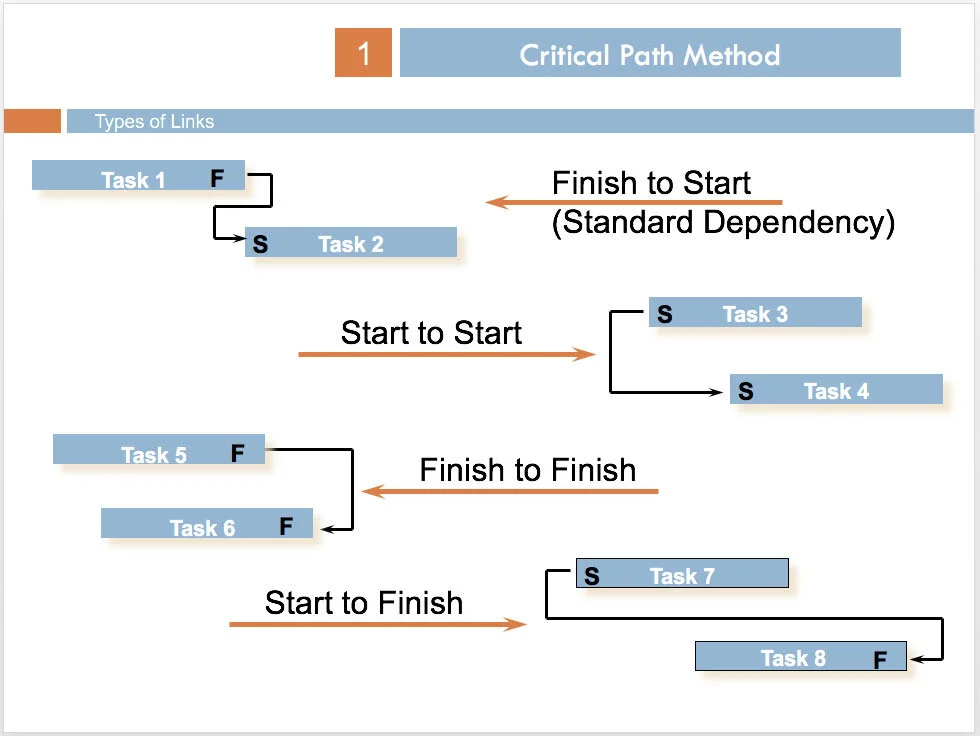
Figure 18. Link types in Microsoft Project

Journal
The different types of names used for determining task logic and the rules for determining what is marked as a critical task in Microsoft Project should suggest that there are rules to follow for building a schedule with the best results.
In the early years of project management software development, reviewers would take a consistent data set and build a project in the different software. The software that calculated the shortest schedule was evaluated more favorability. Why do you think that was the case?
A pilot gets ready for a flight by going through a checklist to make sure everything is working the way it needs to. In the same way, you should have a list of things to review to make sure your schedule is being calculated correctly.
What is your scheduling engine checklist? How do you know if a task has been automatically leveled or scheduled around resource availability?
What are the three primary types of links?
What is auto-linking, and how do you turn the feature on or off?
If you cook for large dinner parties or Thanksgiving, for instance, you have a lot of Finish-to-Finish dependencies. Why?
What is lead or lag in a dependency or link?

Best Practice
Continuously review all of the scheduling engine settings with your projects until all of these aspects of the scheduling engine become second nature. There is no easy way to avoid or evade this deep learning. This is the major part of Mastering Microsoft Project.
Only link detail tasks and milestones. Avoid linking summary tasks.
The premise of Network Diagraming is that every node, detail task and milestone, has meaningful relationships with other nodes (detail tasks and milestones). Every detail task and milestone should have at least one link line coming into it and at least one line going out.
Last, avoid redundant links. In the example above, the Start task precedes all other tasks, but there is no reason to make it a predecessor to each and every task.

If you are working with a coach, save and email them these files (17 - 3 Dataco - Scheduling Engine.mpp should look like Figure 16, and 7 - 4 Types of Links.mpp should look like Figure 17). If you are not working with a coach and you are planning to apply to either MS Project Master Class certificate, archive these completed simulation files so that you can submit them for review.

Return to the Master Class Book and review the next section for this Activity.

Analyze Critical Path (20 minutes)
Review
Read the Content Link above on Critical Path and Working with the Critical Path. (jump to)
Next, review the following sets of graphics and descriptions (#2 - #10) until you have a good sense of the Critical Path Method.

Figure 19. Graphic 2, how the Forward Pass and Backward Pass is calculated.
Graphic 2
The Forward Pass calculation is something we have been calculating since we were kids when we calculate point A to point B. The Backward Pass is really what is new in Critical Path Method.
Project Story
I drive between Boulder, Colorado to Tampa, Florida two or three times a year and I like to see different parts of the country along the way. During my next trip, I am planning to stop and visit Ada, Oklahoma, where my parents grew up and the next place I want to visit on this same trip is Mobile, Alabama. I have been there a few times for business but my wife has not. Plus, I have been wanting to eat at Osman's again.
Boulder to Ada (12 hours)
Two nights in Ada (39 hours) two in Ada
Ada to Mobile, Alabama (11 hours)
Two nights in Mobile (37 hours)
7 hours to Tampa.
When planning this type of trip we are doing the Forward Pass calculation of Critical Path Method
Figure 20. Boulder to Tampa, forward pass in the Critical Path Method.
Google Maps of course, doesn’t let you enter stop or stays, if this was entered in Project, it would and you could get as detailed as needed.
This is my next trip, I am leaving Thursday the 18th at 6 AM and expected to get into Tampa Monday the 22nd at 4 PM. Any changes I make along the way, the schedule is recalculated immediately.
Because of the way I am thinking about this schedule, I used the 24-hour calendar so I can travel on the weekend, etc. However, if you look closely at the figure below, MS Project is telling me the trip is going to take over 13 days. Clearly, something isn’t calculating correctly! We are going to debug this in the next simulation.

Figure 21. Trip from Boulder to Tampa with stops.

Debug Calculation Simulation (5 minutes)

Download *.mpp file
To start this simulation, download the Boulder to Tampa.mpp file using the download icon above and open it in Microsoft Project. Rename the file to 7 - 5 Boulder to Tampa.mpp. Make sure your global settings in Project Options are correct and that you are using Microsoft Project 2019.
This project is not calculating the duration of the project correctly on the summary level. We have reviewed the issue here several times. Think about what you know about the scheduling engine and selections. Debug and correct the problem and save the project.
Simulation Results
Once you have fixed the problem, your simulation file should look like the one in the figure below.

Figure 22. Schedule with the correct duration calculation on the summary level.
Critical Path Method
This next section reviews the calculations and related fields in Critical Path Method.

Figure 23. Graphic 3, Total and Free Slack.
Graphic 3
The Backward Pass is really the part of Critical Path Method that is new to most of us.
Once the Forward Pass Calculation is complete, the end date of the schedule is available along with the Early Start and Early Finish dates for all tasks.

Note: In MS Project, The Early Start field is the same as the Start field, and the Early Finish field is the same as the Finish field.
Once the Backward Pass Calculation is complete, Total Slack (Float) and Free Slack can be calculated. Total Slack is the amount of time a task can slip without pushing out the end of the project (if the end of the project has a Timing Constraint or Deadline). A task of zero Total Slack means it is Critical, if the default definition of Critical is used.
Free Slack is the amount of time a task can be delayed without pushing out the start date of the immediate successor. A task could have zero Free Slack but have time in the Total Slack field and not be marked as Critical.

Figure 24. Graphic 4, Notes on CPM.
Graphic 4
Remember, in Microsoft Project all durations and dates are in Working Time as defined by the calendars used for the project.
Microsoft uses the term Slack for the more commonly used term Float. If there is a negative number in the Total Slack field, that number (called Negative Slack), is the amount of working time that task needs to be brought in toward the start date, for the project to be completed on time.

Figure 25. Graphic 5, Illustration of example.
Graphic 5
The following screens are the Critical Path Method (CPM) calculations.
This is a network diagram, like the Network Diagram view in Microsoft Project.
Each square is a node in the network diagram. Detail tasks and milestones in Microsoft Project are the network nodes.
The task name, duration and links are all user-entered.
Early Start, Early Finish, Late Finish, Late Start, Total Slack, Negative Slack and Free Slack are calculated in Critical Path Method.

Figure 26. Graphic 6, Forward Pass.
Graphic 6
During the Forward Pass, Early Start and Early Finish are calculated.
Let’s say the first task (A) starts at zero. The Early Finish for task (A) is (Early Start + Duration = 3).
Task (B) Early Start is 3 if it starts right after (A). (Early Start + Duration = 5).
The longest path in this network diagram is 29, so that becomes the project or schedule finish date.
If these numbers in this graphic represents days, this project is 29 days.
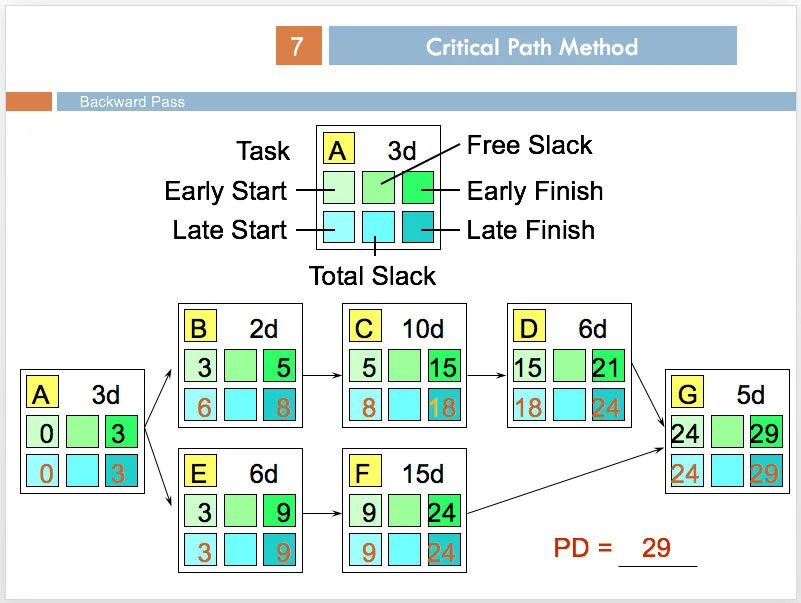
Figure 27. Graphic 7, Backward Pass.
Graphic 7
Once the Forward Pass is completed, the Backward Pass can be calculated.
Starting with the last task (G), the Early Finish is 29, the Late Finish is the same number.
Late Start for task (G) is (Late Finish - Duration = 24)
Late Start and Early Start, along with the Early Finish and Late Finish for the first and last tasks in a network diagram are the same.

Figure 28. Graphic 8, Total Slack.
Graphic 8
Once the Backward Pass has been calculated, Slack is calculated.
Total Slack for a task is the difference between Early Finish and Late Finish.
For task (D) the difference between 21 and 24 is 3. This task has 3 Total Slack.

Figure 29. Graphic 9, Critical Path.
Graphic 9
Once Total Slack is calculated, the Critical Path can be easily identified.
Critical Path is: The longest path or sequence of project activities that control the earliest a project is expected to finish.

Figure 30. Graphic 10, Free Slack.
Graphic 10
Free Slack is the amount of time that an activity can be delayed without delaying the start date of any immediate successor activities.
Mathematically, free float (slack) is calculated as the difference between an activity’s early finish date and the early start date of its immediate successors. If there is no difference, then the activity has no Free Float.
Technically, and this may be the case in Project, Free Slack can be calculated during the Forward Pass.
Task (C) is not on the Critical Path, but, if the task is delayed, it will push out the Early Start date of task (D). If it is delayed more than 3, it will push out the start of (D) and the end date of the schedule.

Network Diagram Simulation (40 minutes)

Download *.mpp file
Formatting Network Diagram Nodes or Boxes
To start this simulation, download the CPM1.mpp file using the download icon above and open it in Microsoft Project. Rename the file to 7 - 6 CPM1.mpp. Make sure your global settings in Project Options are correct and that you are using Microsoft Project 2019.
This project opens with the Network Diagram view applied. While we are in this view, let’s take a look at the features associated with this view.

Note: The network diagram isn’t used a much these days. Printing a network diagram used to very common, more than even printing Gantt Charts. However, this view is still the best place to run a check on dependencies.
Click on the Format tab on the ribbon. The Format tab is divided into four groups.

Figure 31. Network Diagram with the Format tab on the ribbon selected.
The Display group has one command. Click on the Collapse Boxes command (this command operates like a toggle button) and the nodes (tasks) in the Network Diagram only display the Task ID.

Figure 32. Box Styles dialog box for the Network Diagram view.
The Format group resembles the function of editing taskbars in a Gantt Chart view. Edits can be made to just a selected task (Box command) or to the entire network (Box Styles command). The Layout command opens a dialog box for general graphical layout features. Allow manual box positioning will allow you to manually move the boxes around for display purposes. Moving the boxes does not change the schedule. When this radio button is selected, the Layout group becomes active. You can use the Layout Now and Align commands to reposition the nodes (boxes). Again, this does not affect the schedule in any way.
The Box Styles command opens the Box Styles dialog box which gives you the ability to edit or design your own Network Diagram for all of the items in the Style setting for: box.
These style items are:
Critical (tasks that have zero slack or the specified amount of slack or less defined for a critical task in Options)
Noncritical
Noncritical Milestone
Critical Summary
Noncritical Summary
Critical Inserted Project (when another *mpp file has been inserted in the active project)
Critical Marked (there is a field called Marked, it is Yes/No field. This field allows you to flag a task for any reason)
Noncritical Marked (there is a field called Marked, it is Yes/No field. This field allows you to flag a task for any reason)
Critical External (an external link to a task in another *.mpp file)
Noncritical External (an external link to a task in another *.mpp file)
Project Summary (Row zero or the project summary task)
Click on the different items in this box and note that there are different selections below for each item selected.
Templates determine what field data is displayed for a particular item. For instance, Select Critical Summary and then the Noncritical Summary items from the Styles box. Both items are using the same Template, the only difference between the two items is the Border and Background selections.
You can edit and create your own Templates. They are not stored in the Global.MPT file or accessed by using the Organizer. Templates for a Network Diagram type of view are stored within that particular view, in this case, a view named Network Diagram is applied and we are seeing the available templates in that view. Views are stored in either the active project file, or in the Global.MPT file and are copied, moved or deleted in the Organizer.
So, there are boxes that can be drawn for tasks that meet 13 different style criteria like Critical. Each style criteria has a data template selected. Templates determine the task fields that are shown in the box.
In this example, the Template (Example - Critical Path) is a custom Template. In each of the boxes, for Critical, Noncritical, Critical Milestone nodes (tasks), Critical Path Method data is displayed. However, Total Slack and Free Slack are not shown.
Add those two task fields, Total Slack and Free Slack to the Example - Critical Path Template as shown in the figure below. Do this by selecting the Cell Layout button to make sure there are enough rows and by adding the Total Slack and Free Slack fields from the drop-down list of fields. Arrange both fields like those in the figure below.
Figure 33. Box Style and the Data Templates dialog boxes.
To do this, click on More Templates… and select the Example - Critical Path Template.
Click Edit. Add another row and on this row add the Free Slack and Total Slack fields. First, make sure you have the available rows, so click Cell Layout… and add a 4th row.
Add Total Slack and Free Slack fields and be sure to Show Label in cell: and then Click Ok / Close / Ok to note changes.
Save the project to save your changes.
Simulation Results
So far your nodes should have the same fields as those in the figure below. Don’t worry if there are other differences.

Figure 34. Network Diagram highlighting critical tasks (nodes) and displaying CPM calculations.
You can also share these Network Diagram Box Templates between projects. In this next section, you are going to open another project, create a new Network Diagram type of view and then import the Example - Critical Path Template into this new view.
Effectively working with custom elements like Views and the associated aspects of those elements greatly enhance your experience with Microsoft Project. In addition, it will save a considerable amount of time when you learn to share customization between schedules and versions of Microsoft Project. It would be great if all custom elements were stored and shared in one place like the Organizer. In this case, the change to the template is associated with the Network Diagram view, and it is not an element displayed or managed by the Organizer, but the Organizer will still be used to manage the view that the template is kept.

Download *.mpp file
Importing a Network Diagram Template
Leave 7 - 6 CPM1.mpp. open, and download CPM2.mpp by using the download icon above and open in Microsoft Project. Rename the file to 7 - 7 CPM2.mpp.
I want to illustrate another feature in a few minutes, so I would like you to turn something on, that earlier in this program I suggested you keep turned off. Go to File / Options / Advanced / Display and put a checkmark next to Automatically add new views, tables, filters, and groups to the global. This is a global setting, so be sure to uncheck when finished with this simulation.
In 7 - 7 CPM2.mpp, create a new Network Diagram view. Click the View tab on the ribbon. Then click the Other Views command in the first group and then More Views and then New. Create a Single view and then give the view a name. So that you can remember this easily, use your stage name as the name for this new view. If you don’t have a stage name yet, use the name of your first pet as your first name, and your mother’s maiden name as your last. For instance, my first pet’s name was Mickey and my mother’s maiden name was Perkins, so my stage name is Mickey Perkins. In the Screen: field select Network Diagram. In the Group: field select No Group. In the Filter: field select All Tasks, and go ahead and show this new view in the menu. Click OK / Apply.
The next step is to import the Example - Critical Path Template from the Network Diagram view in 7 - 6 CPM1.mpp, instead of creating it from scratch.
You should be able to do this on your own. With 7 - 7 CPM2.mpp active, select the Format tab, open Bar Styles, import the Example - Critical Path template and be sure to select the imported template for Critical, Noncritical and Critical Milestone items.
Last, let’s say you want to make this new network diagram available to any project you open in Microsoft Project.
To do this, you need to make sure the view (your stage name) is in the Global.MPT file with the imported template. Go to the File tab on the ribbon / Info / Organizer and note that the view is already in the Global.MPT. When we created the view, it was placed there because of the selection we checked in Options that told the software to save new views to the Global. However, notice the view is also listed with the project. These are two different views with the same name, in two different files or locations. When we imported the template to this new view we created, it was imported to the view associated with your project when you did the import. The view you created is available for any project you open because it is in the Global, but if you want that view to have the imported template, you will need to copy the view from 7 -7 CPM2.mpt and replace the one in the Global.MPT.

Figure 35. Using the Organizer to copy an element like a view or table associated with a project to the Global.MPT.
Save the project.
The Network Diagram view that ships with Microsoft Project has10 templates as observed in the figure below. When a new Network Diagram type of view is created there is only the Standard template. Remember that if you are ever working with designing a new Network Diagram, what you might be wanting is a template in this Microsoft Network Diagram. You can import any of these templates into a new or existing Network Diagram view.
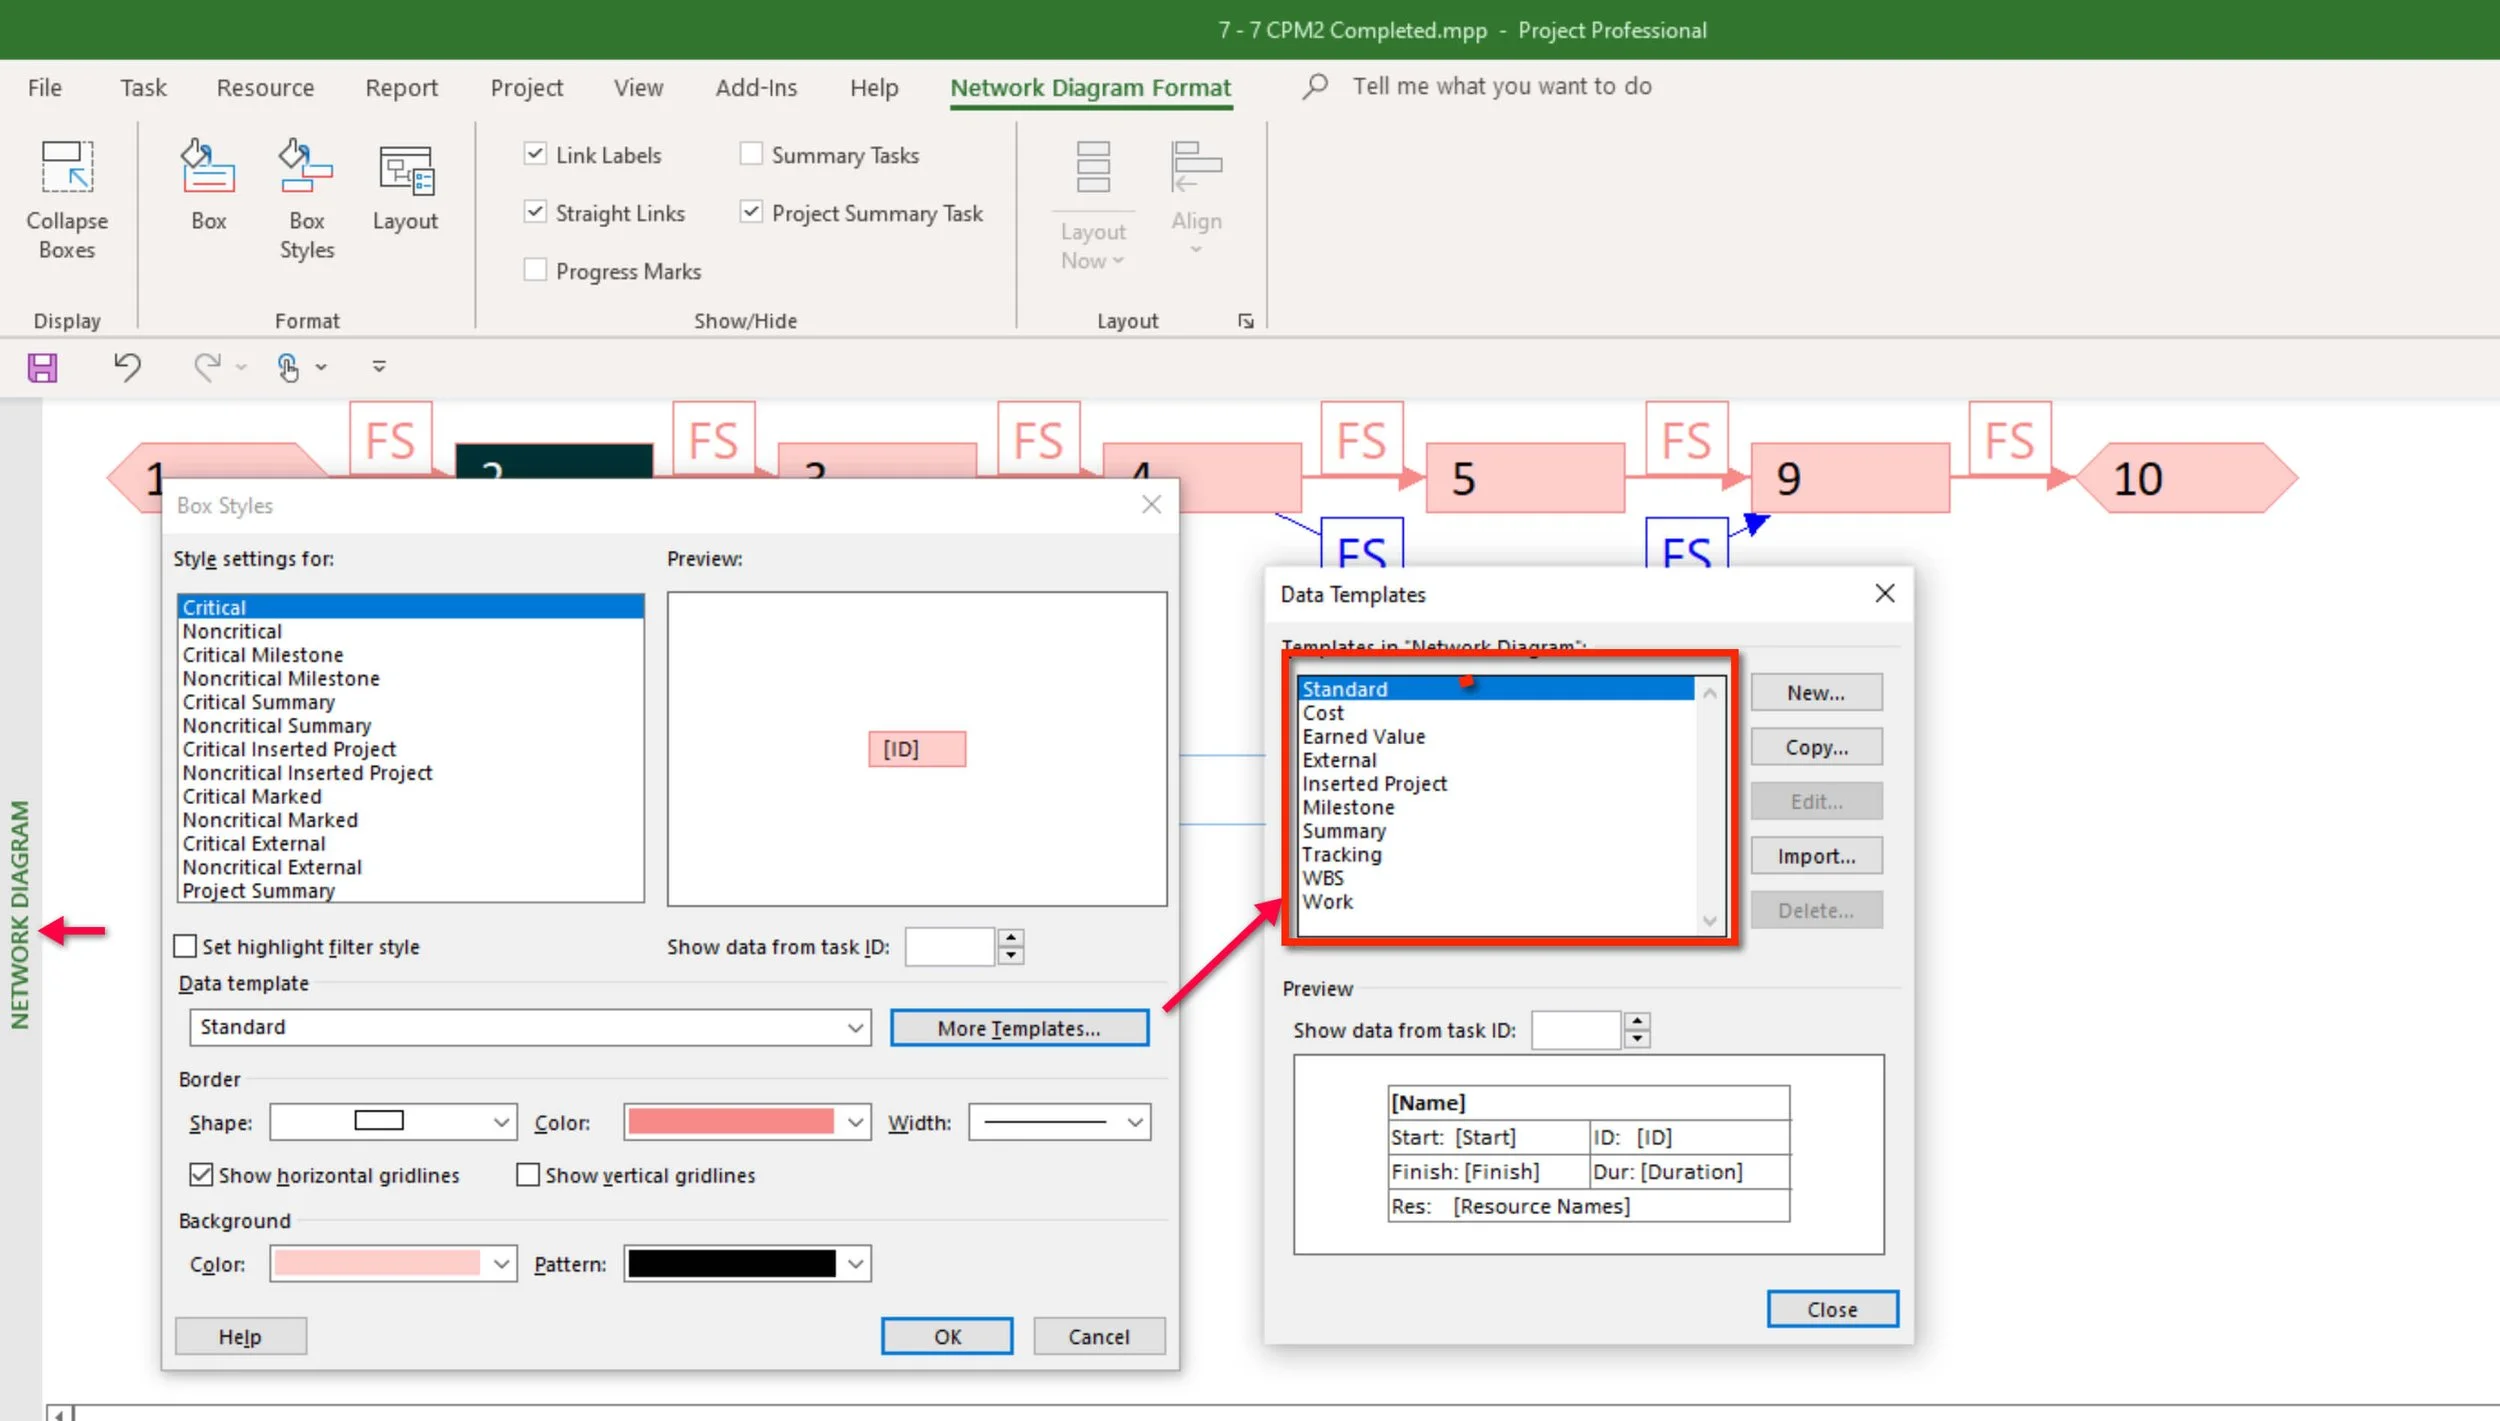
Figure 36. Templates in the Network Diagram view.
Simulation Results
The 7 - 7 CPM2.mpt should contain the Example - Critical Path Network Diagram template.
Figure 37. Simulation results, imported Template into a Network Diagram view.

Project Example
The Network Diagram isn’t as useful as a Gantt Chart is on your computer screen, even with a large monitor. However, if you have access to a plotter and you are in a work culture that values schedules posted to the walls, Critical Tools offer a couple of great products that work with Microsoft Project. I have used their products for years with different customers that were looking for better visual output.
One tool is the traditional WBS organizational chart and the other an Activity on Node Timescale PERT Chart or Network Diagram.
Microsoft released the Windows version of Project in 1990, Critical Tools started in 1991. Critical Tools has been providing trusted 3rd party products for Microsoft Project for 30 years. See: https://www.criticaltools.com/
Observing Critical Path Method in a Gantt Chart View
Let’s go back to 7 - 6 CPM1.mpp. and continue reviewing Critical Path Method in Microsoft Project.
Whenever you make a change, the critical path is recalculated.
For instance, if you are still in the Network Diagram view, select Task D. Then click hold and drag straight down and hold. Notice the link symbol appearing. Continue to drag the symbol to Task F and release. The critical path is recalculated.
Tip: That is the 10th way to set links between tasks we have reviewed.
Let’s change views and look at this critical path information in Microsoft Project’s central display or a Gantt Chart view.
Select the Task tab on the ribbon and then click the Gantt Chart command.
Apply an existing table that has the elements of the critical path calculation (View / Tables / More Tables / Bridge Critical Path / Apply) and then zoom the entire project (View / Entire Project command). Note the early and late dates along with TS (Total Slack) and FS (Free Slack).
You can also display Critical Path and Total Slack in the Task Bars (Format / check the Critical Tasks and Slack commands).
As you already know, there is a shortlist of items that can be automatically formatted in the table that is applied to this Gantt Chart view. Automatically format the background of critical tasks.
Answer the following questions and enter your answers in the Notes field for Task E.
If you needed to shorten the duration of this project, which tasks would you focus on first?
Let’s say that someone comes to you and says, “We are having some difficulty and we would like to delay the start of Task E until the 1st of February.” What would you say?
In this view, the critical tasks in the table are automatically formatted with an orange background. Clearly, the Start and Finish tasks are critical. Why are they not formatted?
Last, uncheck Automatically add new views, tables, filters, and groups to the global. (File / Options / Advanced / Display.)
Save the project.
Simulation Results
7 - 6 CPM1.mpp should look like the figure below. A table showing CPM is applied, the critical tasks and slack are formatted. Answers to three questions should be in the Notes field for Task E.

Figure 38. Simulation Results, Critical Formatted in the table and view. Slack formatted in the taskbars side of the window pane.

Journal
When we think about scheduling anything, don’t you think there is a significant gap in how we schedule most anything and how we schedule in project management software? What are those differences? When we schedule a trade show, a trip, or a wedding, we certainly follow a different set of rules.
What is your definition of a Critical Path?
What are the criteria for a critical task in Microsoft Project?
What is calculated in the Forward Pass?
What is calculated in the Backward Pass?
In CPM, what is the simple formula for:
Early Start
Early Finish
Late Start
Late Finish
Total Slack
What is Free Slack?
If you need to shorten the duration of a project, what do you focus on?
What is the difference between hard logic and soft logic?

Best Practice
Critical Path Method begins with you making a couple of passes through a schedule and setting links between detail tasks and milestones.
In the first pass through the schedule, link tasks based on hard logic, Ask, “What must precede a task?”
During the second pass, apply soft logic. You can’t do everything at once, so ask, “What do I prefer to do before something else?”

If you are working with a coach, save and email them these files (7 - 5 Boulder to Tampa.mpp should look like Figure 22, 7 - 6 CPM1.mpp the Network Diagram view should look like Figure 34 and the Gantt Chart should look like Figure 38. Task E should have the answers to two questions in the Notes field, and 7 - 7 CPM2.mpp should have the Network Diagram template observed in Figure 37 ). If you are not working with a coach and you are planning to apply to either MS Project Master Class certificate, archive these completed simulation files so that you can submit them for review.

Return to the Master Class Book and review the next section for this Activity.

The 4 Hour House
In 1945 in Santa Rosa, California, the building association attempted to build a house as fast as they could, as a promotional stunt and to study building practices. Since then, almost every year groups of people around the world, attempt to build something (mostly houses, office buildings, hotels, skyscrapers, and bridges) in record time.
This short video is one of the earliest made on these record-building residential home attempts. In 1983, the Building Industry Association of San Diego County held a team competition among its construction trades. The challenge was to build a house from the foundation to finish in less than four hours to break the existing world record while meeting strict building codes. Considered an impossible task, two 350 member teams had to completely rethink the house-building process. The winning team completed their house in a record 2 hours and 45 minutes.
With this particular house, there were plenty of issues and the eventual owners complained about quality issues that were not addressed by the builder, however, this complaint is heard in almost all production home neighborhoods across the country. Since this house was built in the 80s, there have been houses built faster and better in record times, but the tools and techniques have remained much the same in terms of Duration Compression, Fast Tracking and Crashing a schedule.
Habitat for Humanity
For example, Habitat for Humanity routinely builds hundreds of homes in just a few weeks. One of their key techniques is controlling for inspection; all inspectors are there on-site. These inspectors immediately point out what needs to be corrected.
In 2002 they built a house in 3 hours, 26 minutes and 34 seconds.
Project Example
I have restored five historic homes in Tampa, St. Petersburg and a small city in Colorado’s front range. The permitting process has an impact on extensive restoration and remodeling. In Colorado, I walk down to the permit office and get a permit for a fence, or to install a new exterior door, or to redo the entire plumbing in about five minutes. When I am ready for the inspection, I call the city, they usually answer the phone by the second ring and schedule the next day to inspect. In Tampa, the inspection process is nothing less than a mind-numbing, time-wasting nightmare. I could literally waste a day attempting to get a permit.
Proximity to lumber yards, hardware stores, plumbing and electrical supply stores is another factor that can impact the duration of a project. At one location in Historic Ybor City, I was good 30 minutes or more to most supply houses and if you had hit more than one store it could take a couple of hours. In Colorado, all supply stores are within a mile drive with no traffic. I could literally visit Lowes, Home Depot, Ace Hardware, Budget Supply, and two or three supply houses in less than an hour.
Project Example
On June 12th, 2006 a small plane crashed into the Tate House in my neighborhood in Tampa. The Tate family owned a local pizzeria that was popular and they had a large extended family, so most people in the area knew them. Due to a set of unfortunate circumstances involving the status of their insurance, the FAA, and the owner of the plane, the Tate family was unable to rebuild their home.
The TV show Extreme Makeover built the Tate’s a new house.
Timeline for this Tampa Extreme Makeover
01/08 Monday: House demolished
01/09 Tuesday: New slab for the house is poured
01/10 Wednesday: Framing and roof go up
01/11 Thursday: Plumbing, electric, and drywall work are done
01/12 Friday: Cabinets, tile, and garage door are all installed
01/13 Saturday: Final touches. Flooring and landscaping completed
01/14 Sunday: Tate family returns to a brand new home
Figure 39. Before and after of the Tampa Extreme Makeover home.
Exercise
View the 4 Hour House video (10:44) below. The general specs on this house are:
Production home, but all cuts made onsite
Around 1500 square feet
Stick house built on a concrete slab
3 bedrooms 2 ½ bath
Built from the ground up
Includes landscaping - ready to move in
When you are done, complete the journal questions related to this exercise.
The 4 Hour House Video

Journal
Make a note in your journal of things the planners and participants did on The 4 Hour House video that is not standard building practices, related to:
In this video, what was done to compress the duration?
(For instance, they made this attempt with a single-story house, built on a slab rather than a basement, and it was stick construction vs. concrete block.)
What are some examples of fast-tracking you noticed in the video?
(For instance, they poured the slab, framed much of the house, and built the roof simultaneously.)
What are some examples of crashing?
(For instance, the event directors created a competitive environment, they built two houses side by side with a different team-building each house. The idea is that competition creates fun and is a strong performance motivator.) For example, the Petronas Twin Towers in Kuala Lumpur, Malaysia, were built by two competing construction companies. See video of the Petronas Twin Towers construction.

Best Practice
In Microsoft Project, when fast tracking or crashing, we focus on “critical” tasks. Those tasks that if changed could shorten the duration of the project.

Return to the Master Class Book and review the next section for this Activity.

Create a Master Project and Link Between Projects
Review
Read the Content Link above on Managing Links Across Projects. (jump to)

Cross Project Links Simulations (20 minutes)

Download *.mpp files
Download these three files using the download icon above and save the files to the same folder. There is no reason to open them just yet.
Software Project.mpp
Software Development.mpp
Software Testing and Deployment.mpp (Rename this file to 7 - 8 Software Testing and Deployment.mpp)
We are going to create a Master Project by inserting these projects and then creating and managing links across all three projects.
This is one of the more powerful features of the software, but as you will see in a few minutes, it is also very easy to set up.
In this example, let’s say you are managing a software project but you have different project managers managing different phases or major deliverables of the project. Each manager has their own Microsoft Project project.
Not only do you want to report across all three projects, but you also want the project manager of the development team, for example, to start their project when the design for the software is completed in another project. You want this manager to see any push or pull dates coming from an external predecessor when they open their project.
You also want to see all of these projects as one project in the Master project.
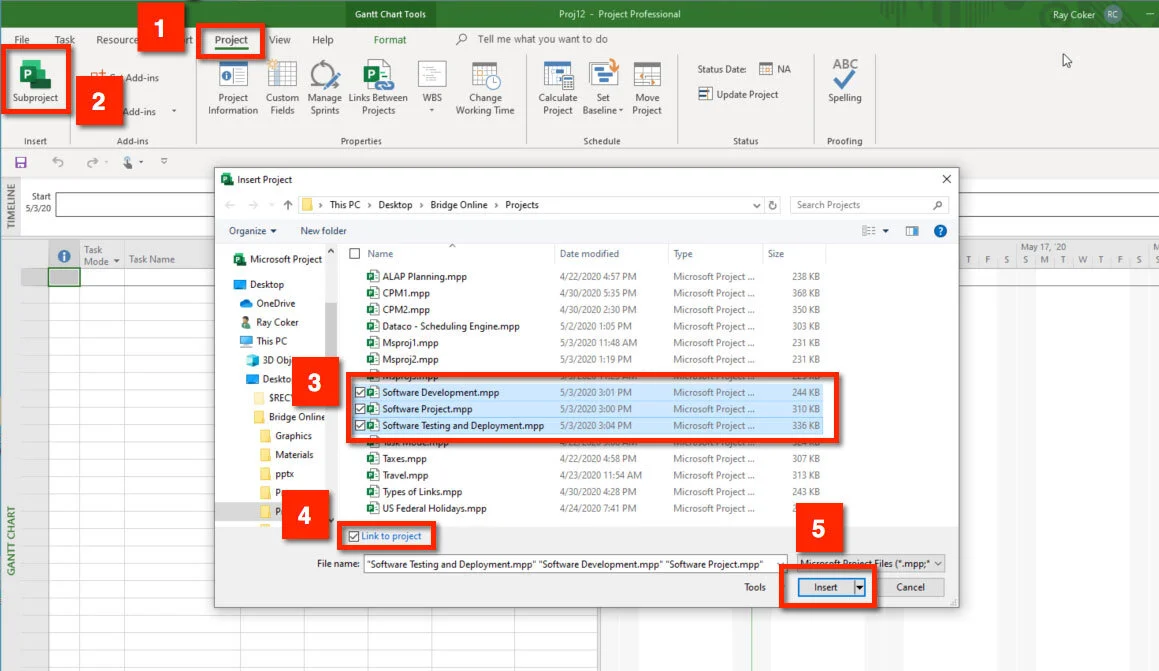
Figure 40. Insert subprojects into a master project.
To create a Master Project, start with a blank project. The next step is to insert the projects.
Inserting Projects into a Master Project
Step 1: While in the blank project, go to the Project tab on the ribbon and, Step 2: select the Subproject command. In the Insert Project dialog box shown above there are three things to do.
Step 3: Select the projects you want in the Master. You can select them in any order you want, and rearrange them once they are in the Master by moving them just like a summary task is moved in a regular project.
Step 4: These inserted projects are called source projects. Always checkmark Link to project to make sure there is a connection to the source projects.
Step 5: Last, because you are linking to the source projects, you can make changes to a project either in the Master or by opening the actual project.
There may be other times when working with Master Projects that you only want changes flowing one direction, from the source project to the Master, not from the Master down to the source. In that case, use the Insert button to Insert Read-Only.
In this example, you are going to set links between these projects from the Master, so you don’t want to Insert Read-Only, you want changes in the Master, which will be links across projects, to flow down to the source projects when the changes are saved.
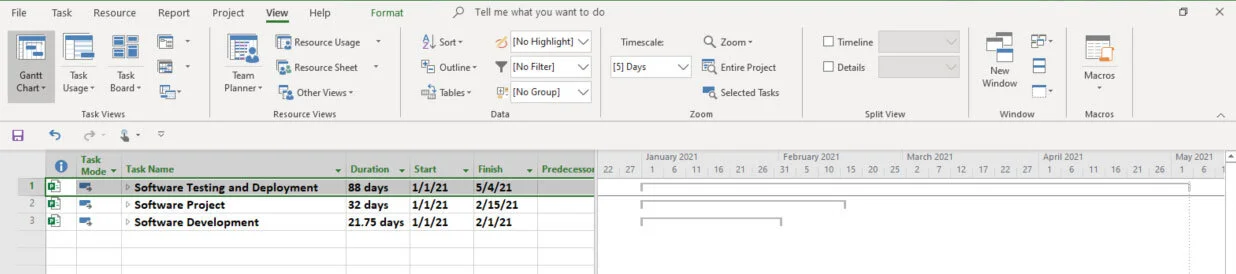
Figure 41. Inserted subprojects.
Notice the three projects inserted in the screen above are collapsed. There is a reason for that, in fact when you save a Master project with one or more projects expanded, the Master Project always opens with projects collapsed. When you expand a project, the software is literally pulling in all of that data from the project at that moment. If you have a lot of large projects this can put a strain on your computer, so it is much better to expand each project, one at a time as needed.
Notice above that all three projects start at the same time. Perhaps, in this example, we cannot deploy until the software is developed, which is why we are going to create some links across these projects.
Create a blank project and insert these three files into the blank project.
After you have inserted these projects into the Master, make sure these projects are placed in chronological order. Select 7 - 8 Software Testing and Development, if it is out of order, and drag it to the bottom just like you would drag a task. Put the projects in this order:
Software Project
Software Development
Software Testing and Deployment
Expand Software Project, scroll down, and expand the Software Development project.
Create three links:
(1) Create a link between the first two projects.
In the Software Project, make ID 24, Design Complete a Finish to Start predecessor to ID 3, Review functional specifications in the Software Development Project. This is a cross project link as shown in the figure directly below. Observe in the Predecessor field the location of the external predecessor is shown.

Warning: This is not a database environment, if you are inserting projects locally and are not using Project Server. If the location of inserted projects are moved, the locations in the Master Project are not updated.
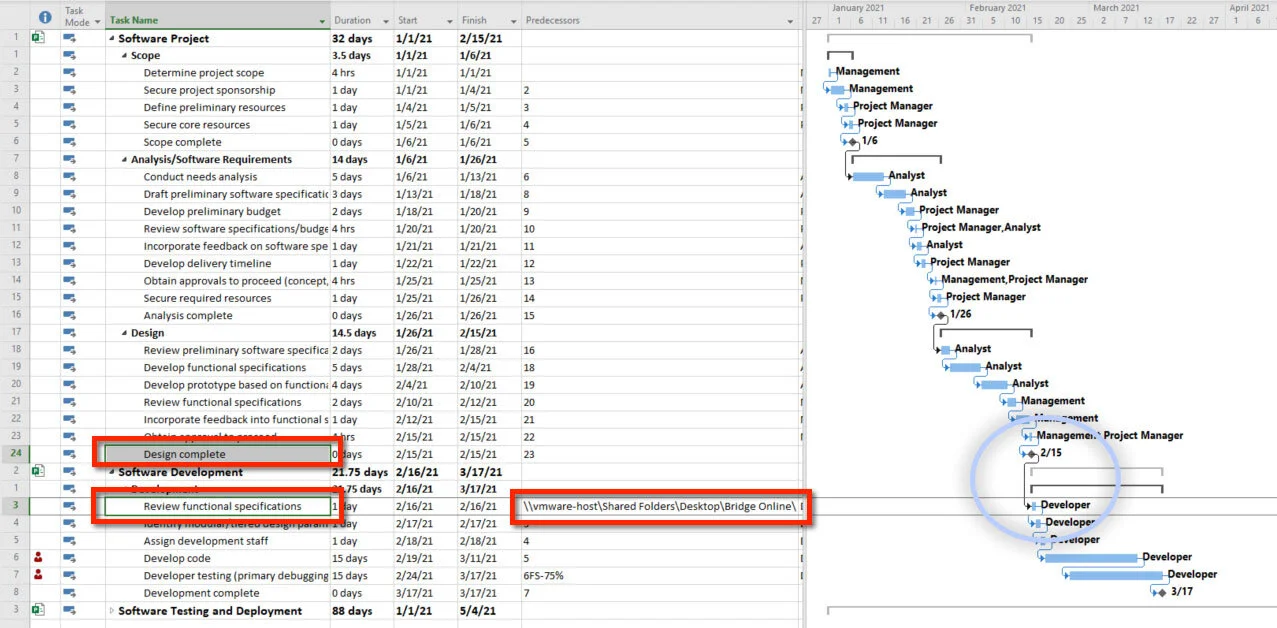
Figure 42. Cross project link. Design complete in one project is a predecessor to Review functional specifications in another project.
(2) Collapse the Software Project and expand the 7 - 8 Software Testing and Deployment project.
Create a Finish to Start link between ID 8, Development complete in the Software Development project, and ID 3, Develop unit test plans using product specifications in the 7 - 8 Software Testing and Deployment project. This is also a cross project link.
(3) Create a Standard Dependency between ID 3 and 4 in the 7 - 8 Software Testing and Deployment project. This is just a link between two tasks in a project.
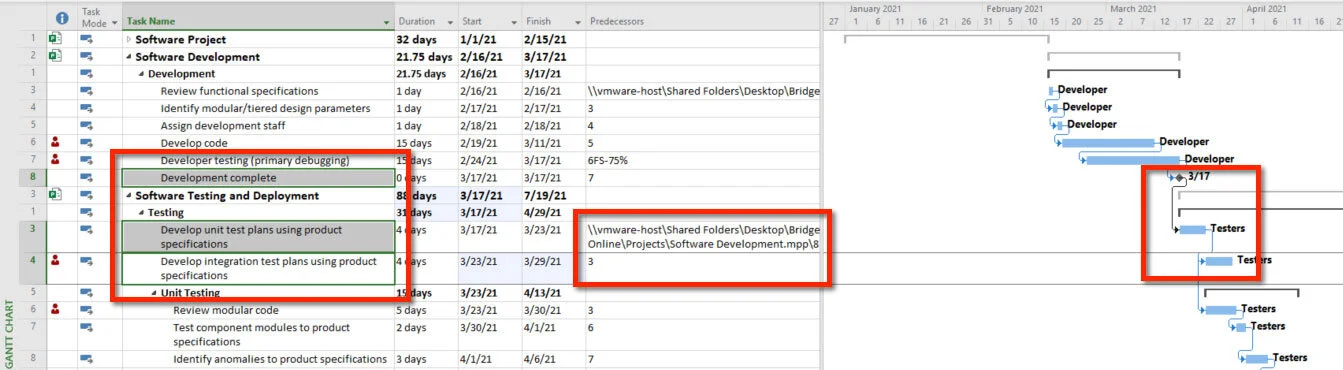
Figure 43. Cross project link across projects and a standard link within a project.
Save the Master Project and give it any file name you want. Microsoft Project is going to ask you if you want to save changes to each of the projects. In this case, you do.
Close the Master Project and then open the 7 - 8 Software Testing and Deployment project.
You will notice a couple of things. The project now starts in March, the external predecessor is displayed, and the location of the external predecessor is shown in the Predecessors field.
If you want, without disturbing the links in any way, you can turn off the display. In addition, you can choose to automatically accept updates from external links or accept them on demand. To see options related to cross project links, select the File tab / then Options / Advanced / Cross project linking options for:.
Select the Project tab and then Links Between Projects command. Regardless of what is showing in your display you can see and manage your external links in this dialog box. This is also a good place to delete a link if you want.
Simulation Results
If you are working with a coach or plan on obtaining a certificate just email or archive the 7 - 8 Software Testing and Deployment project. As shown in the figure below, the external task should be shown along with the location of the external link in the Predecessor field. In addition, standard dependency was created between ID 3 and ID 4.
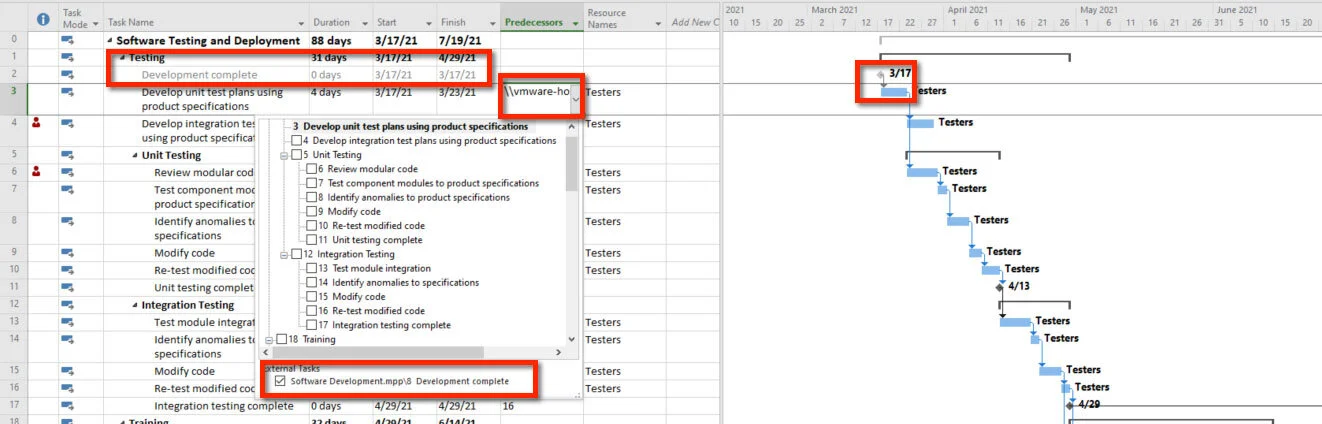
Figure 44. Source project opened showing an external link.
Project Example

I made myself a promise that I would always warn people about overdoing external links after a hard experience at Lockheed Martin in Marietta, Georgia. I had been doing a lot of training in the F-22 Raptor group. After one of the classes, I was asked to come back in to fix some problems with a Master Project. It was a secured area, so I had a guard walk me into the area. I had to wear a flashing beacon around my neck, I had to carry a roadside flashing beacon and while I was there lights flashed on the ceiling and over the intercom, a voice kept repeating, “intruder in building” and people across a sea of cubes would stand up at times and give me a look.
They had created a Master Project with hundreds of cross project links. It just didn’t work and I made a commitment that I would always tell people that linking across projects is a great feature, if used carefully and sparingly. One of the reasons there were problems is because it is very easy to create circular dependencies and in this case when the circular dependencies could not calculate the software would crash.
To better manage an environment with a lot of cross project links, many customers manage two project files. Project A has nothing but all of the external links, and then those tasks in Project A are linked to the appropriate tasks in the actual project. A manager first opens Project A, accepts all of the updates from the external projects, makes sure everything is working correctly, and then opens the actual project and accepts all of the updates from Project A.
Before returning to the Master Class Book, make sure your MS Project Master Class Plan.mpp is up to date. These four parts of the plan should be completed up through Activity 7:
Work Breakdown Structure.
Estimates of duration for each detail task.
Links between all detail tasks.
Actual time on each detail task entered in the custom Timesheet column.
If you are working with a coach email this file too.

Journal
How do you insert a project into a Master Project?
When you insert a project, do you always have to link to the source projects?
If you do not want to change to a project, if you make a change to the project in the Master, how do you have to insert the project?
Why are projects collapsed when you open the Master Project?

Best Practice
Limit the number of external links. I can’t stress how important that is, it can get really confusing. Second, be careful not to create circular dependencies.

If you are working with a coach, save and email them your simulation file, 7 - 8 Software Testing and Deployment.mpp to review. This project should look like Figure 44. If are planning to apply to either MS Master Class certificate, archive this completed simulation file so that you can submit them for review.

Return to the Master Class Book and review the next section for this Activity.

Review of Best Practices
Task Mode
Learn to use Auto Scheduled tasks. Don’t use Manually Scheduled tasks after the estimating phase of planning.
If you are using Manually Scheduled tasks at this point in planning you are missing the primary reason for using project management software that has a scheduling engine. All tasks should be Auto Scheduled at this point in the planning process.
Scheduling From
The purpose of scheduling from the finish date is to eventually determine when a project should start. Once you have determined when to start, schedule from the start date and enter that date. This is done in Project Information.
Scheduling Engine
Learn all of the rules associated with the features listed below and the subsequent schedule behaviors. There is no shortcut and no other way to master Microsoft Project.
Project Start Date
Scheduling From the Project Start Date or Project Finish Date
Calendars
Schedule Selections in Options
Task Type (Fixed Duration, Fixed Units, Fixed Work) crossed by Effort Driven (Yes or No)
Resource Assignments
Task Mode (Manually or Auto Scheduled)
Task Constraints
Links or Dependencies
Continuously review all of the scheduling engine settings for your projects until all of these aspects of the scheduling engine become second nature. There is no easy way to avoid or evade this deep learning. This is the major task of Mastering Microsoft Project.
Summary Tasks
In general, with the exceptions of notes, don’t make any changes to summary tasks. Allow summary tasks to just reflect what is indented below them, rather than attempting to interact with indented tasks and milestones. This best practice will make it easier to work with and interpret changes to schedule.
Timing Constraints
When you first deploy a schedule, most of your detail tasks, milestones and summary tasks should be ASAP or ALAP. During deployment, the dates associated with tasks often become more fixed in time.
Do not use any other Timing Constraint for a summary task except ASAP.
Don’t type dates in the Start or Finish fields. Entering dates for a task also creates a timing constraint.
Linking
Only link detail tasks and milestones. Avoid linking summary tasks.
Make sure that every detail task and milestone has at least one predecessor and one successor.
The premise of Network Diagraming is that every node (detail task and milestone in this case) has meaningful relationships with other nodes (detail tasks and milestones). Every detail task and milestone should have at least one link line coming into it and at least one line going out.
Avoid redundant links or dependencies. Too many links has a negative impact on software performance and lines all over the map makes it difficult to figure out what is going on.
Critical Path
When attempting to shorten a schedule, focus on critical tasks; those tasks that are driving the duration of the project.
Critical Path Method begins with you making two passes through a schedule and setting links between detail tasks and milestones.
In the first pass through the schedule, link tasks based on hard logic, Ask, “What must precede a task?”
During the second pass, apply soft logic. You can’t do everything at once, so ask, “What do I prefer to do before something else?”

Complete this Activity by completing the exam.
Activity 7 Exam
Figure 46. Activity 7 Exam.
Simulation Files
MS Project Master Class Plan.mpp (Through this Activity, this project should include all of the activities, estimates of duration, you should be assigned at the appropriate amount of work, all of the activities are linked together with standard dependencies and should be scheduled appropriately. You should have a Must Finish on finish date for the last task and you should have a record of the time you have spent on each activity to date)
7 - 1 Task Mode.mpp (Typically, your simulation files that are sent to coaches and reviewers do not need to match perfectly. Coaches will be looking to make sure you are getting the ideas and features being covered. This file should closely match Figure 9)
7 - 2 Travel.mpp (Your simulation file should appear like Figure 13)
7 - 3 Dataco - Scheduling Engine.mpp (Your simulation file should look similar to the one in Figure 16)
7 - 4 Types of Links.mpp (Your simulation file should look similar to the one in Figure 17)
7 - 5 Boulder to Tampa.mpp (Your simulation file should look like Figure 22)
7 - 6 CPM1.mpp (The Network Diagram view should look like Figure 34 and the Gantt Chart should look like Figure 38. Task E should have the answers to two questions in the Notes field.)
7 - 7 CPM2.mpp (The file should have the Network Diagram template observed in Figure 37.)
7 - 8 Software Testing and Deployment.mpp (This project should look like Figure 44.)

Using Process Bridge? Its easy to follow the workflow…
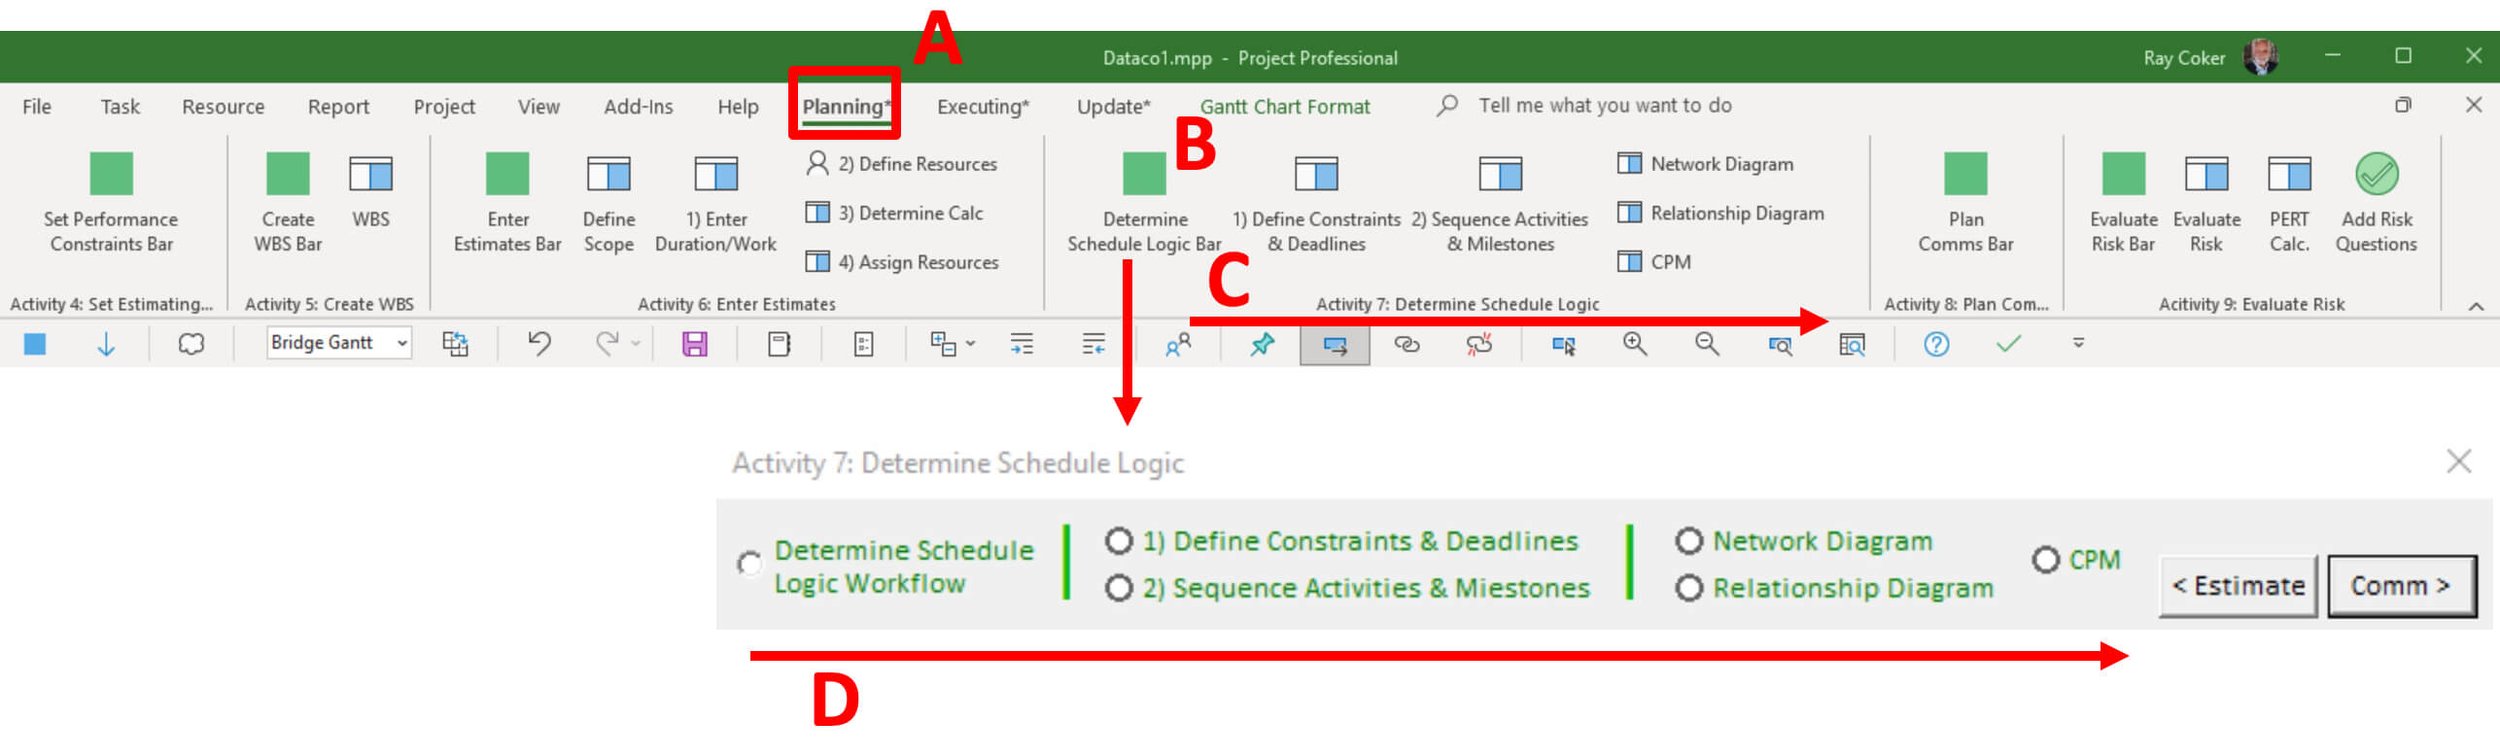
Figure 47. Activity 7: Determine Schedule Logic in Process Bridge.
You can either use the Planning* tab on the ribbon or the Activity 7: Determine Schedule Logic floating toolbar to walk through this Activity.
A - The Determine Schedule Logic workflow is under the Planning tab on the ribbon.
B - Select the Determine Schedule Logic Bar command to open the Determine Schedule Logic floating toolbar.
C - From Activity 7: Determine Schedule Logic group…
1) Define Constraints and Deadlines
2) Sequence Activities & Milestones
Apply the Network Diagram
Appy the Relationship Diagram
Apply the Critical Path Method table in a Gantt Chart View
D - From the floating toolbar…
View the Workflow online
1) Define Constraints and Deadlines
2) Sequence Activities & Milestones
Apply the Network Diagram
Appy the Relationship Diagram
Apply the Critical Path Method table in a Gantt Chart View
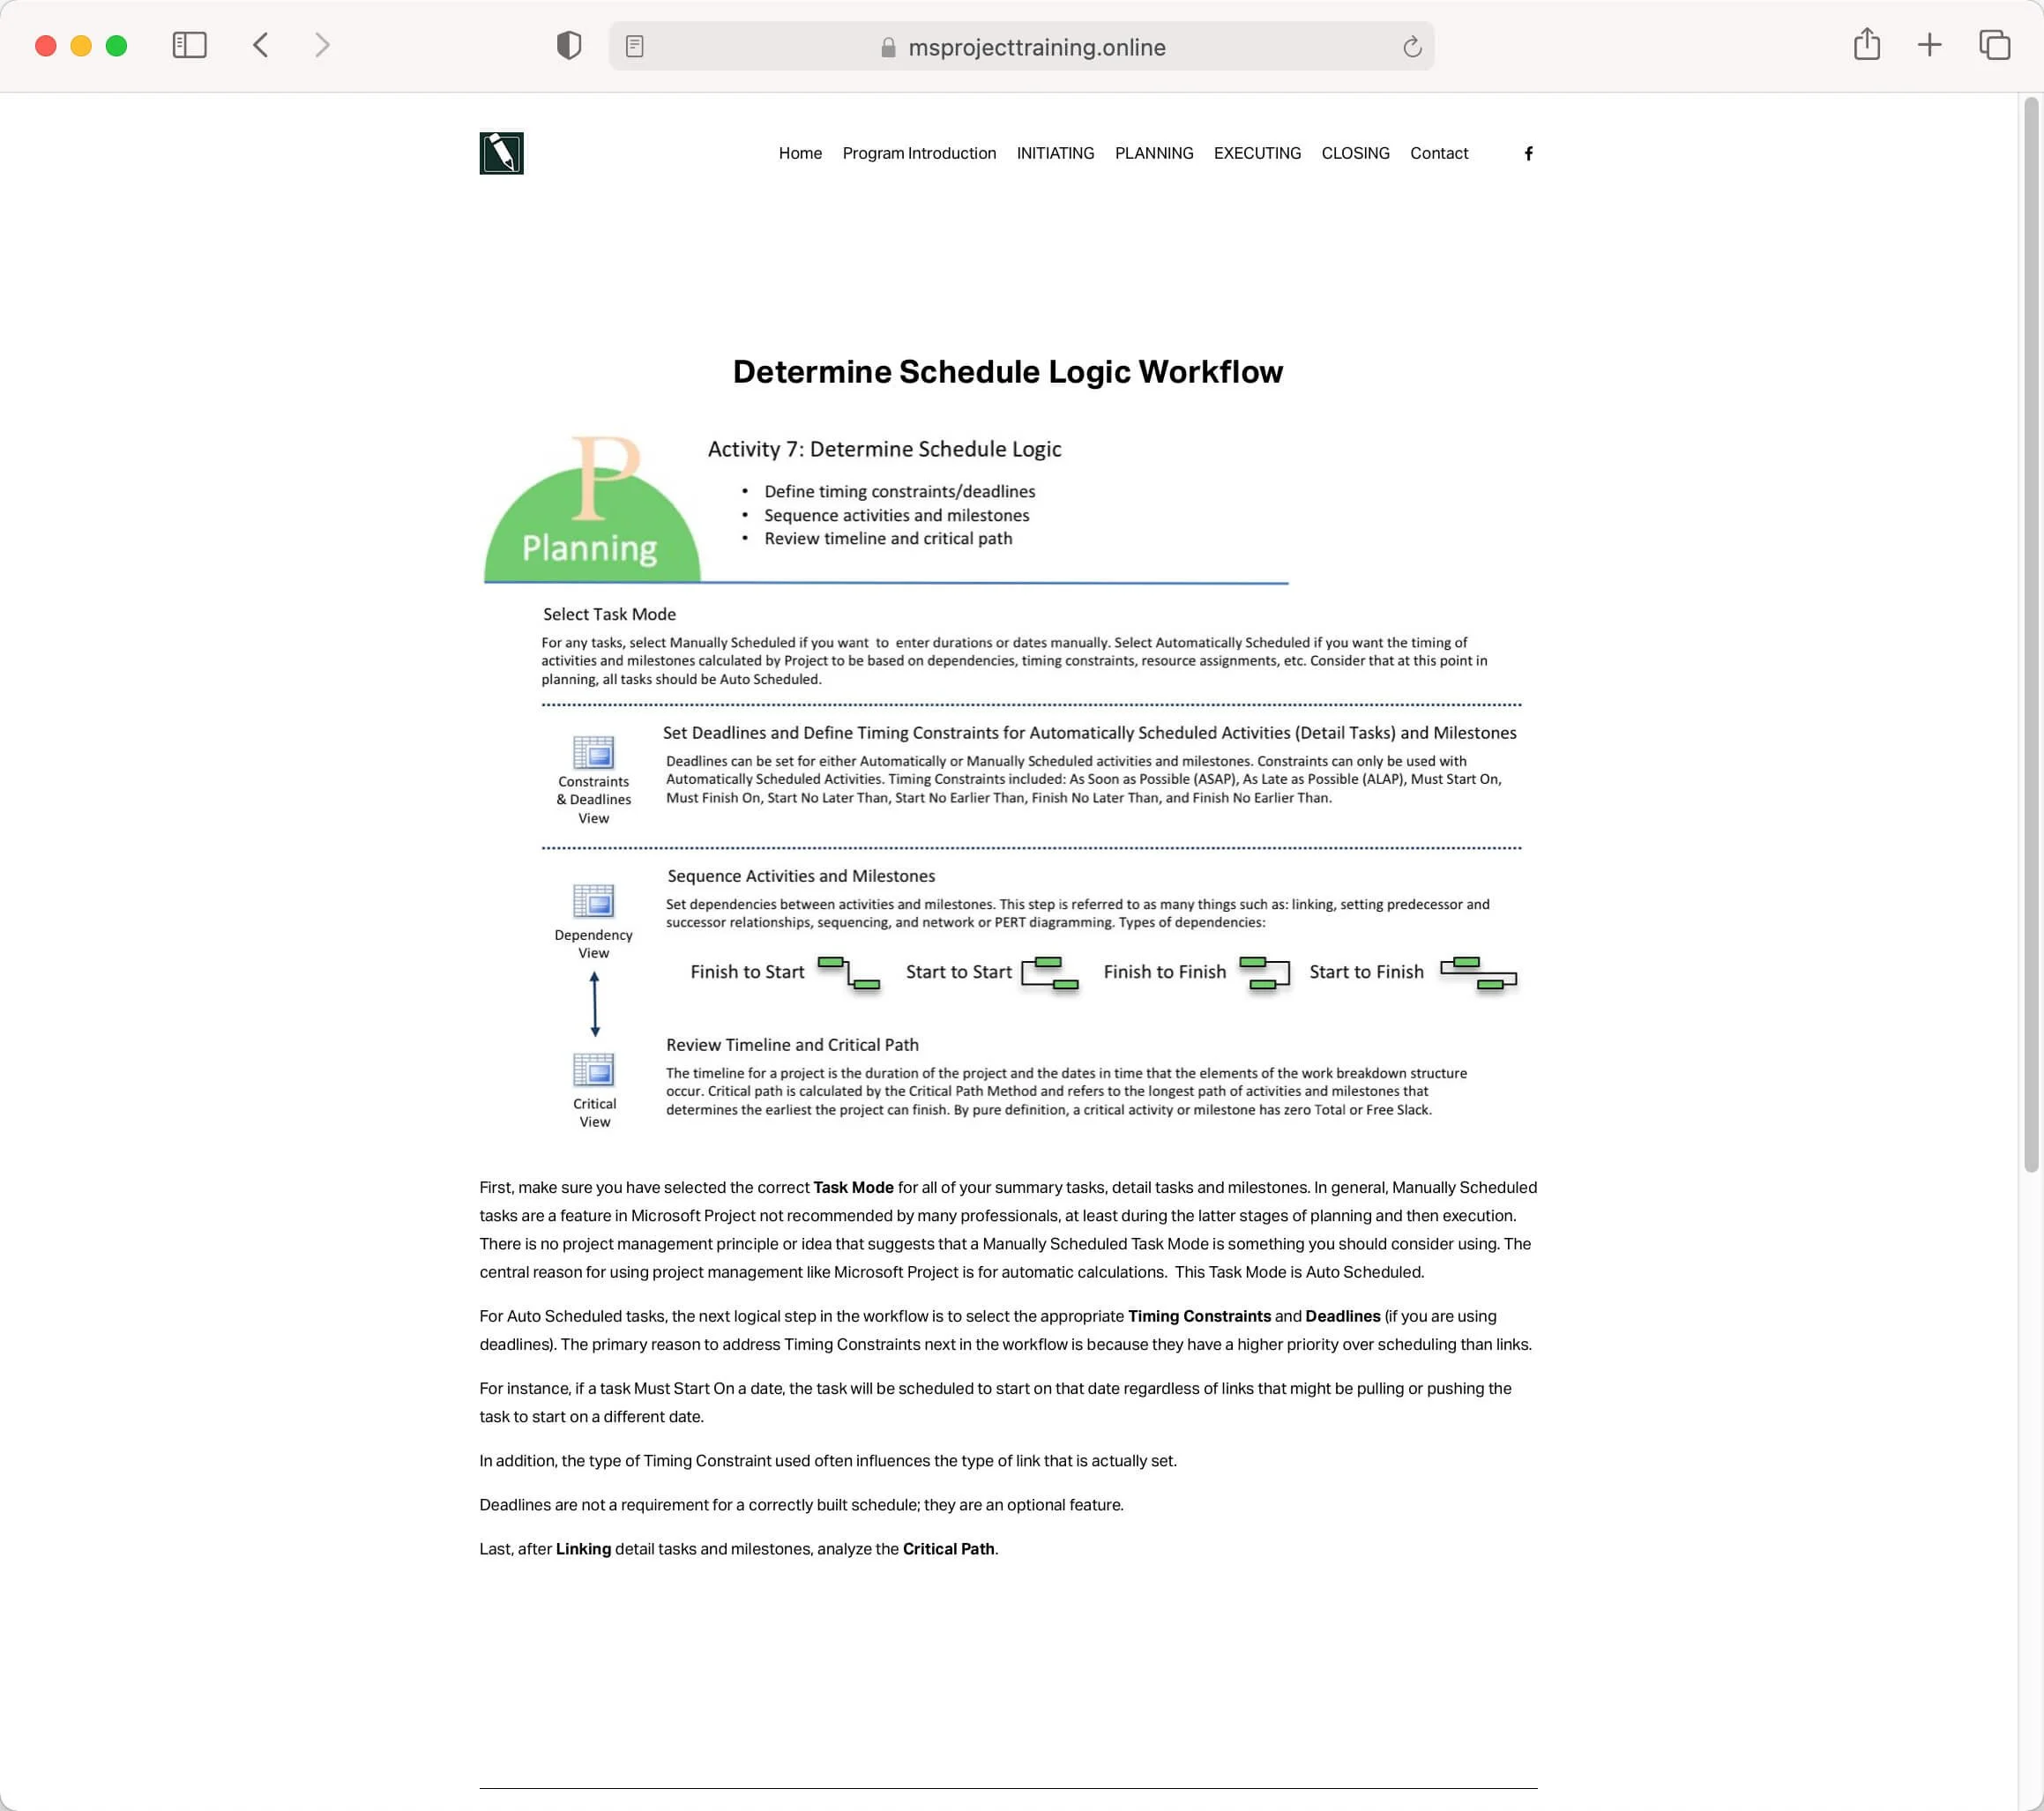
Figure 48. Determine Schedule Logic Workflow online.
Click the Determine Schedule Logic Workflow radio button on the floating toolbar to open the workflow online.
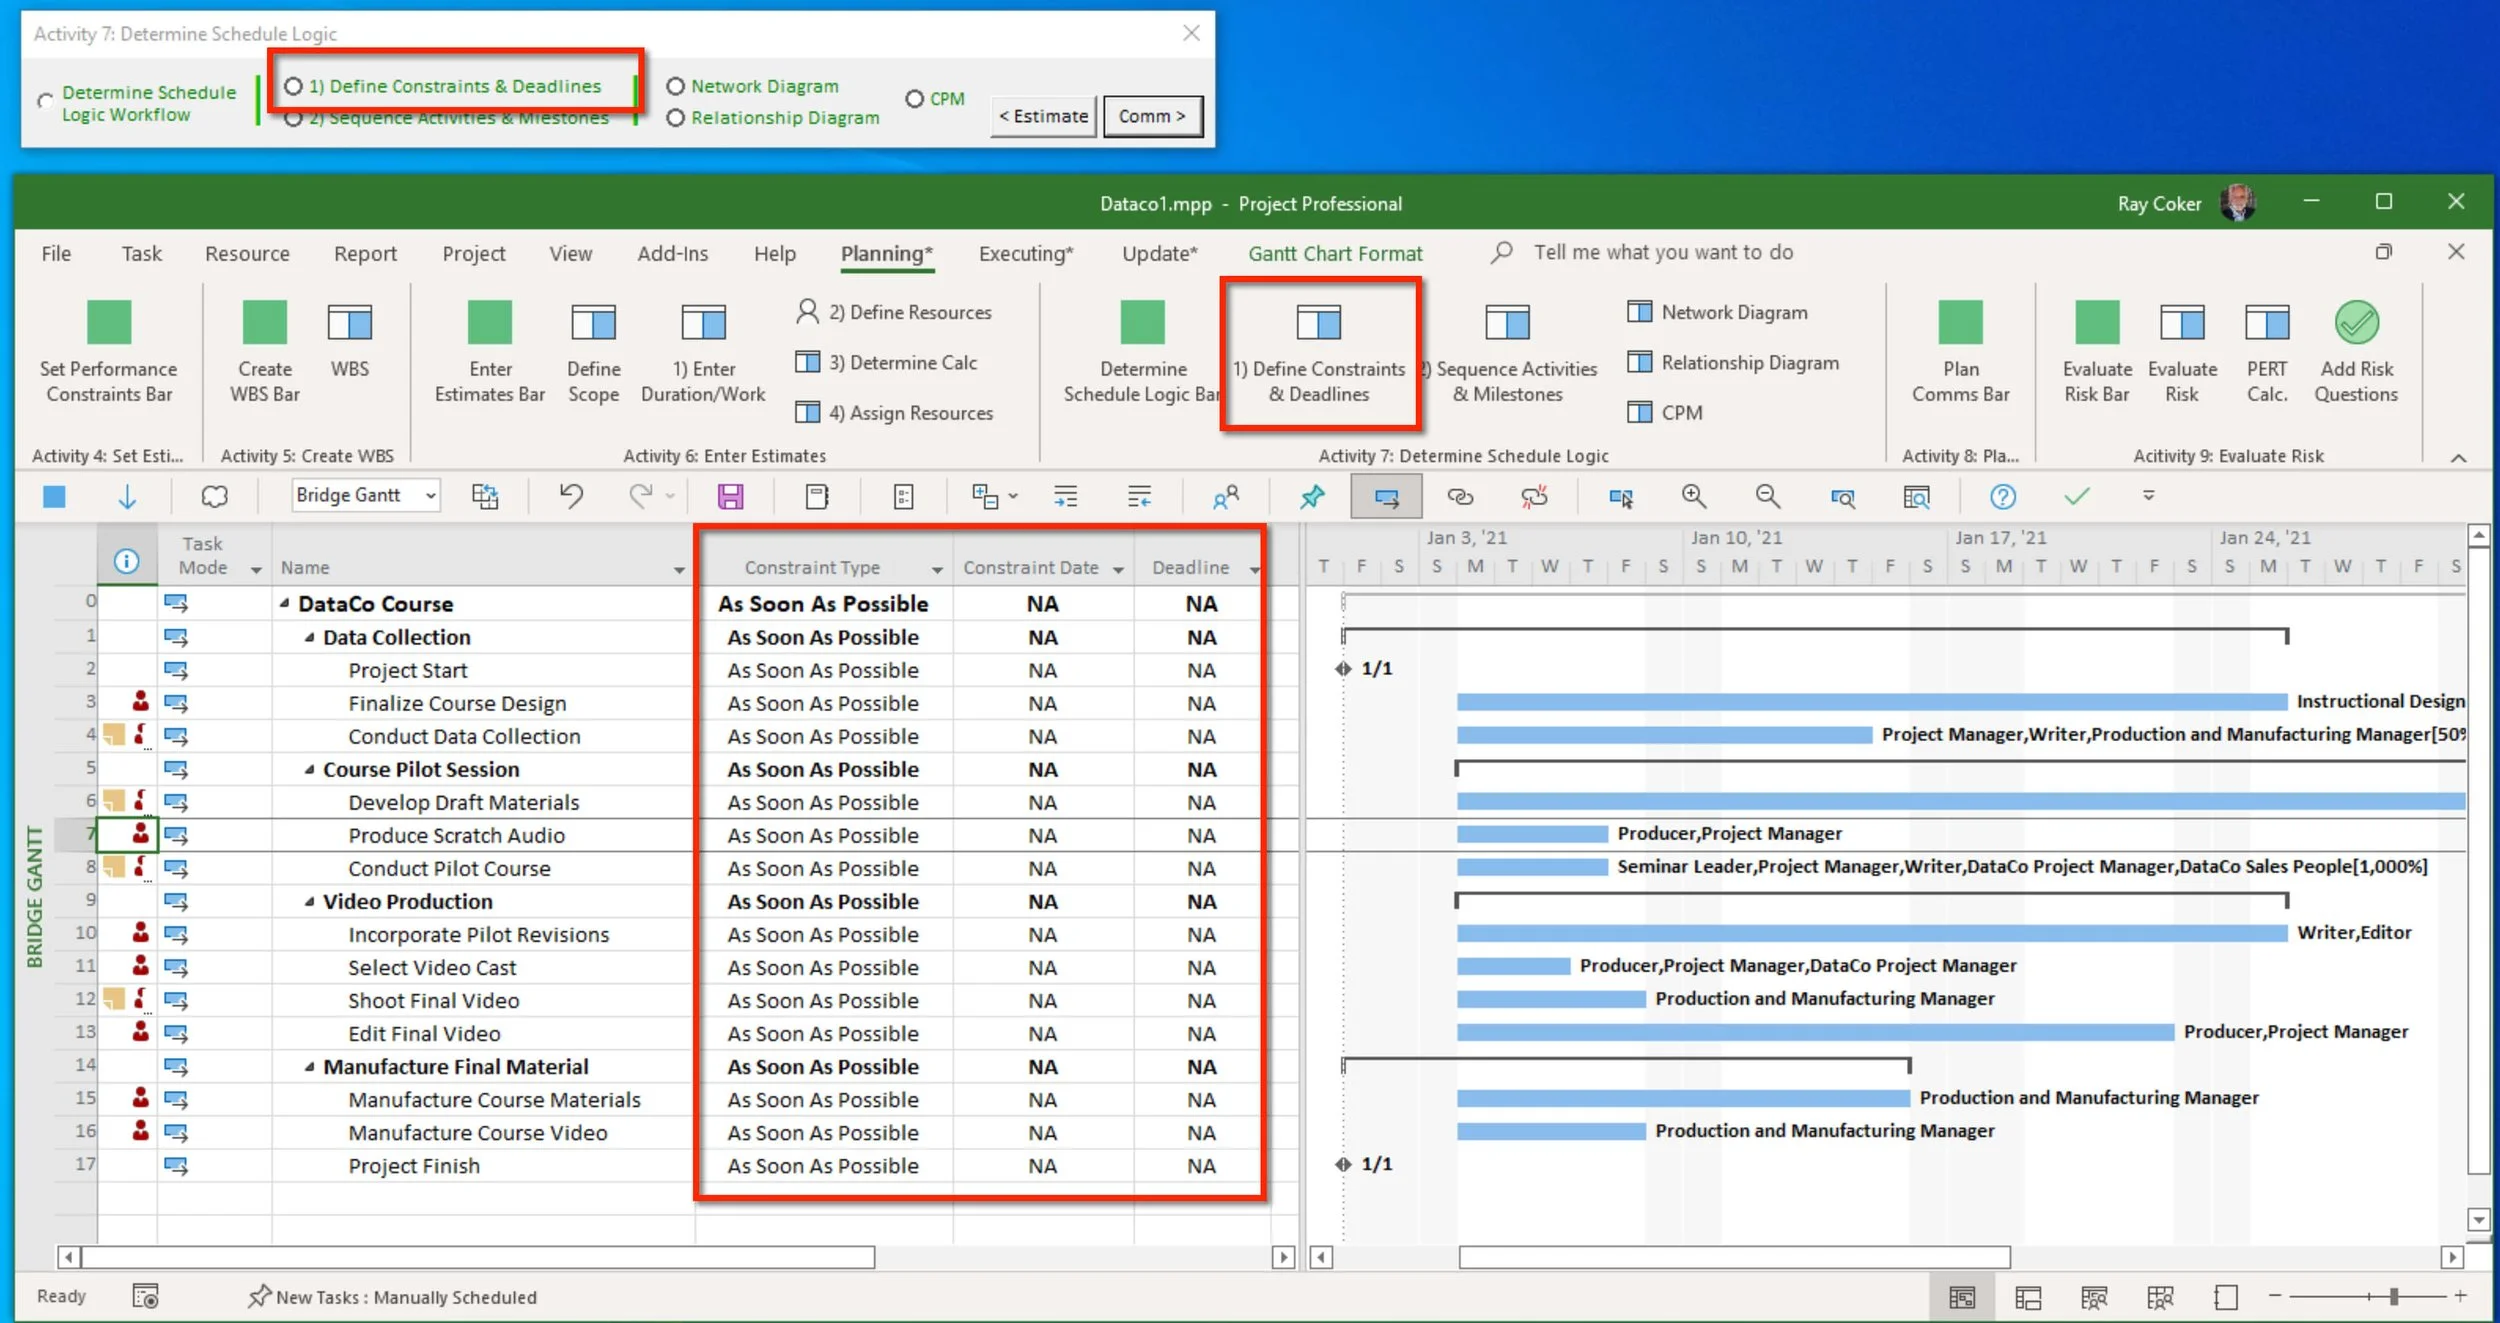
Figure 49. Gantt Chart with Constraint Type, Constraint Date and Deadline Date fields displayed.
Click the 1) Define Constraints and Deadlines View command.
A Gantt Chart view is applied. The table in the view has the Constraint Type, Constraint Date and Deadline Dates fields inserted.
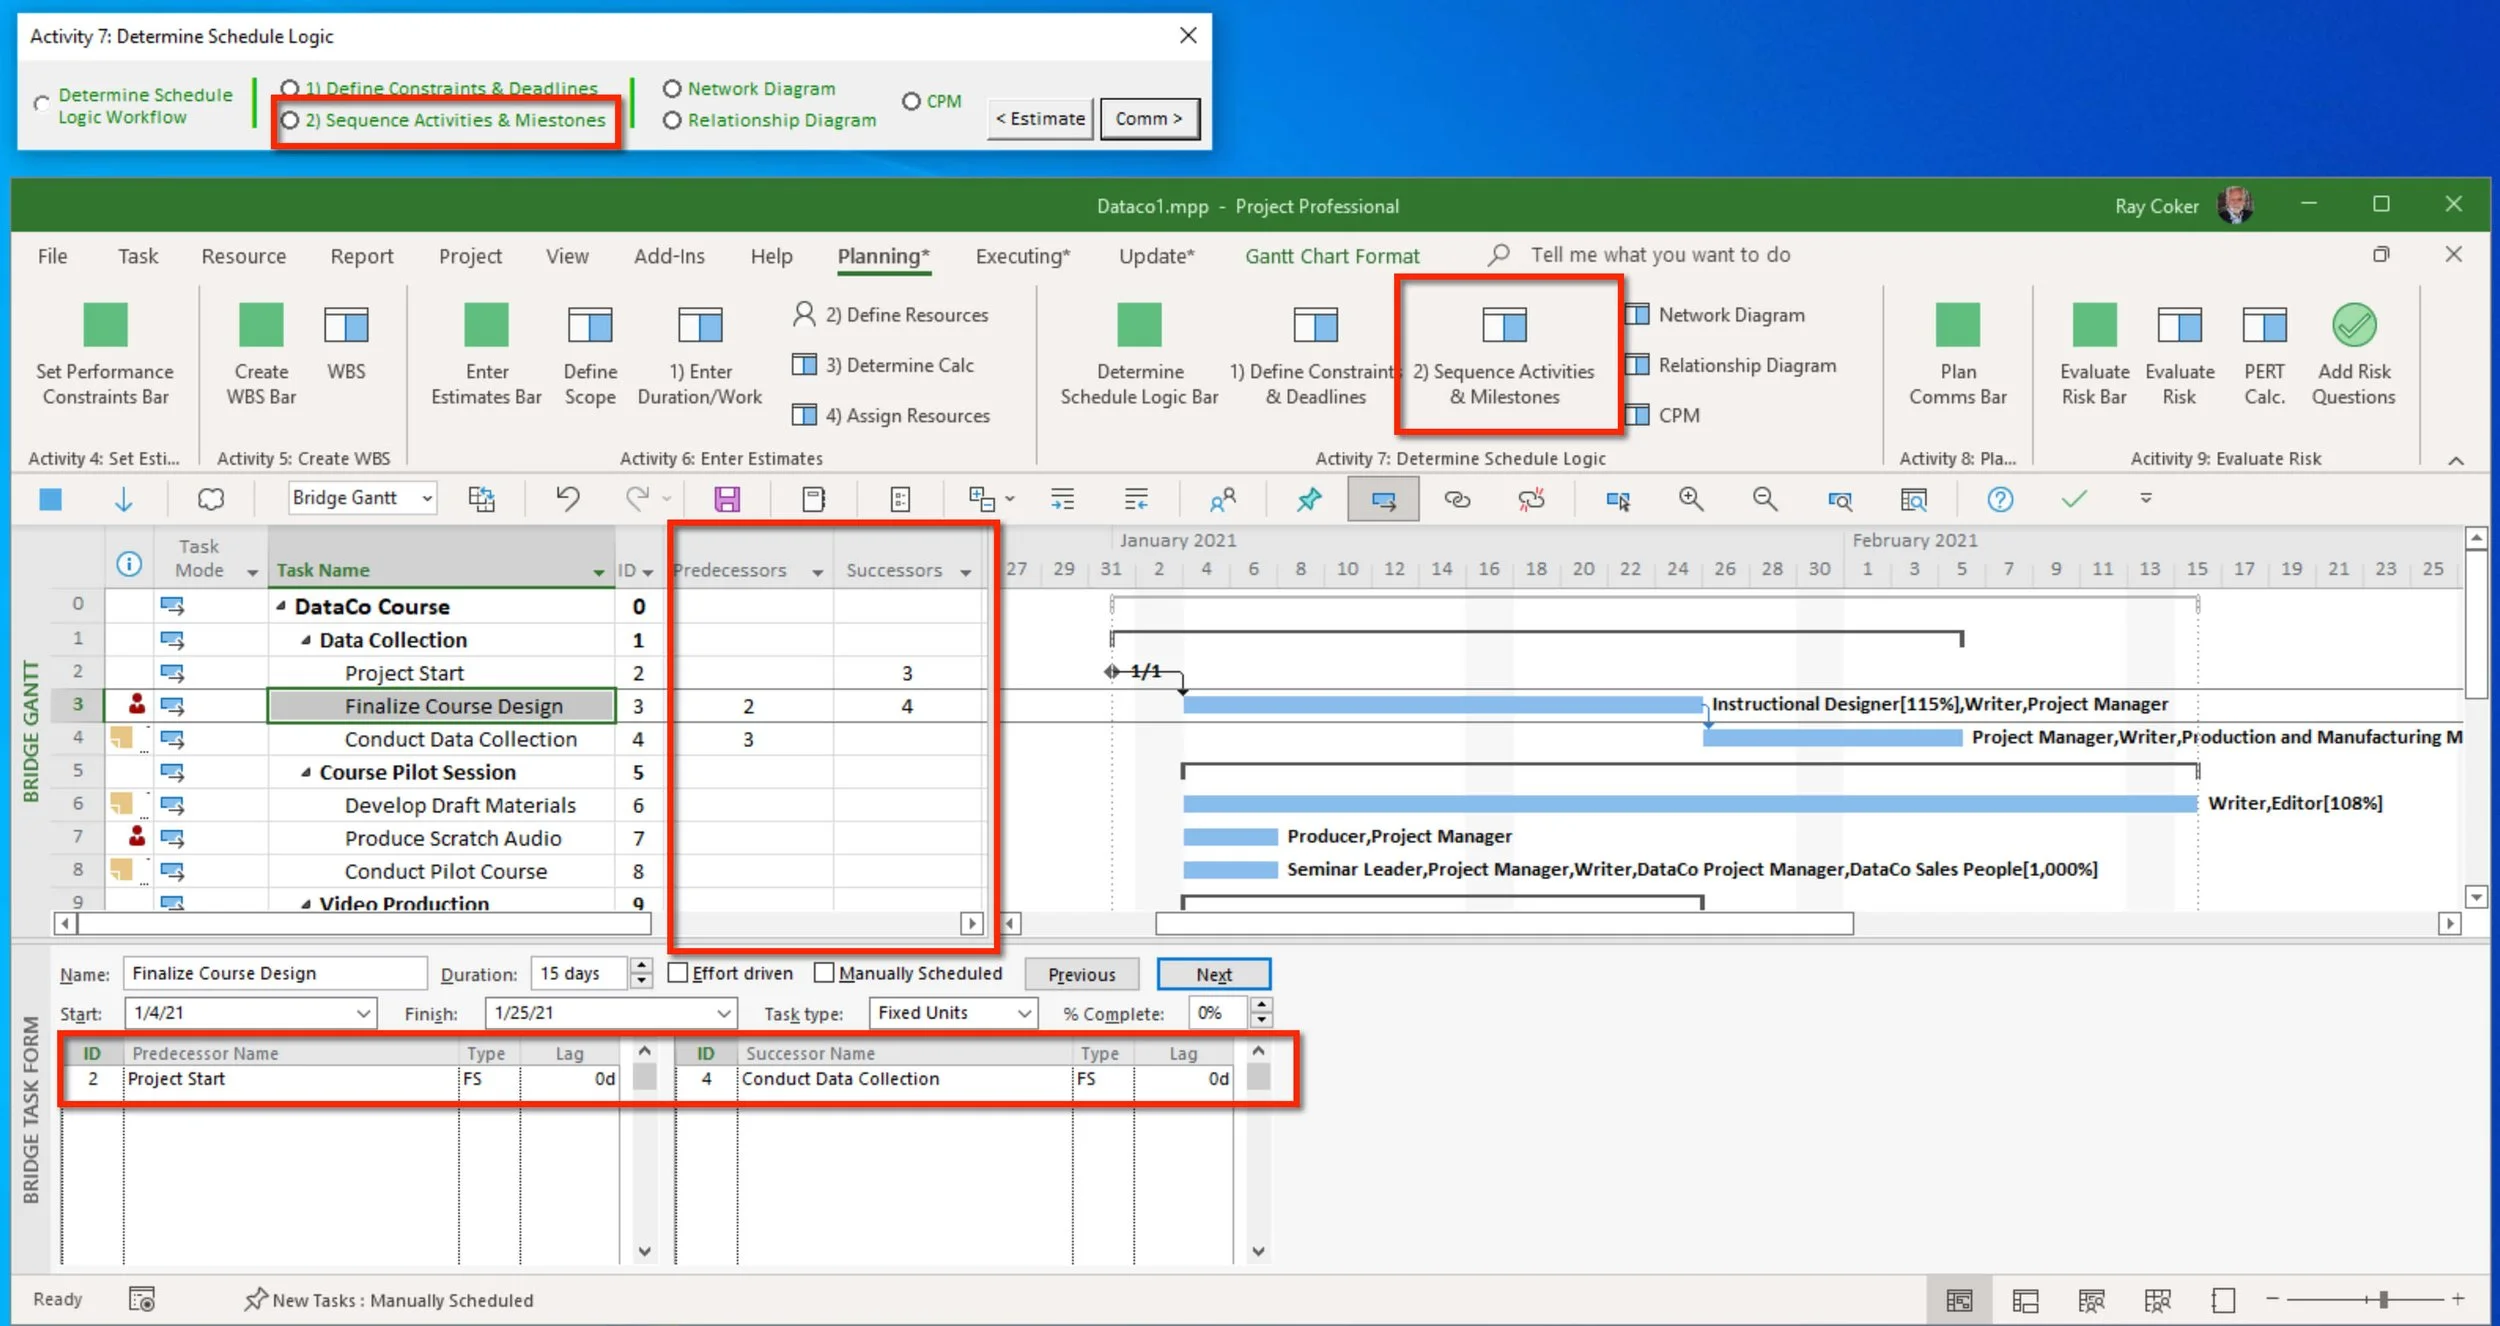
Figure 50. Split window with a Gantt Chart showing Predecessors and Successor fields in the top view and a Task Form view on the bottom with Predecessors and Successors for a selected task.
Click the 2) Sequence Activities & Milestones command.
A Gantt Chart view is applied. to the top of a slip window. The table in the view has Predecessors and Successors fields inserted.
A Task Form is applied to the bottom of the split window with the Predecessors and Successors theme applied.
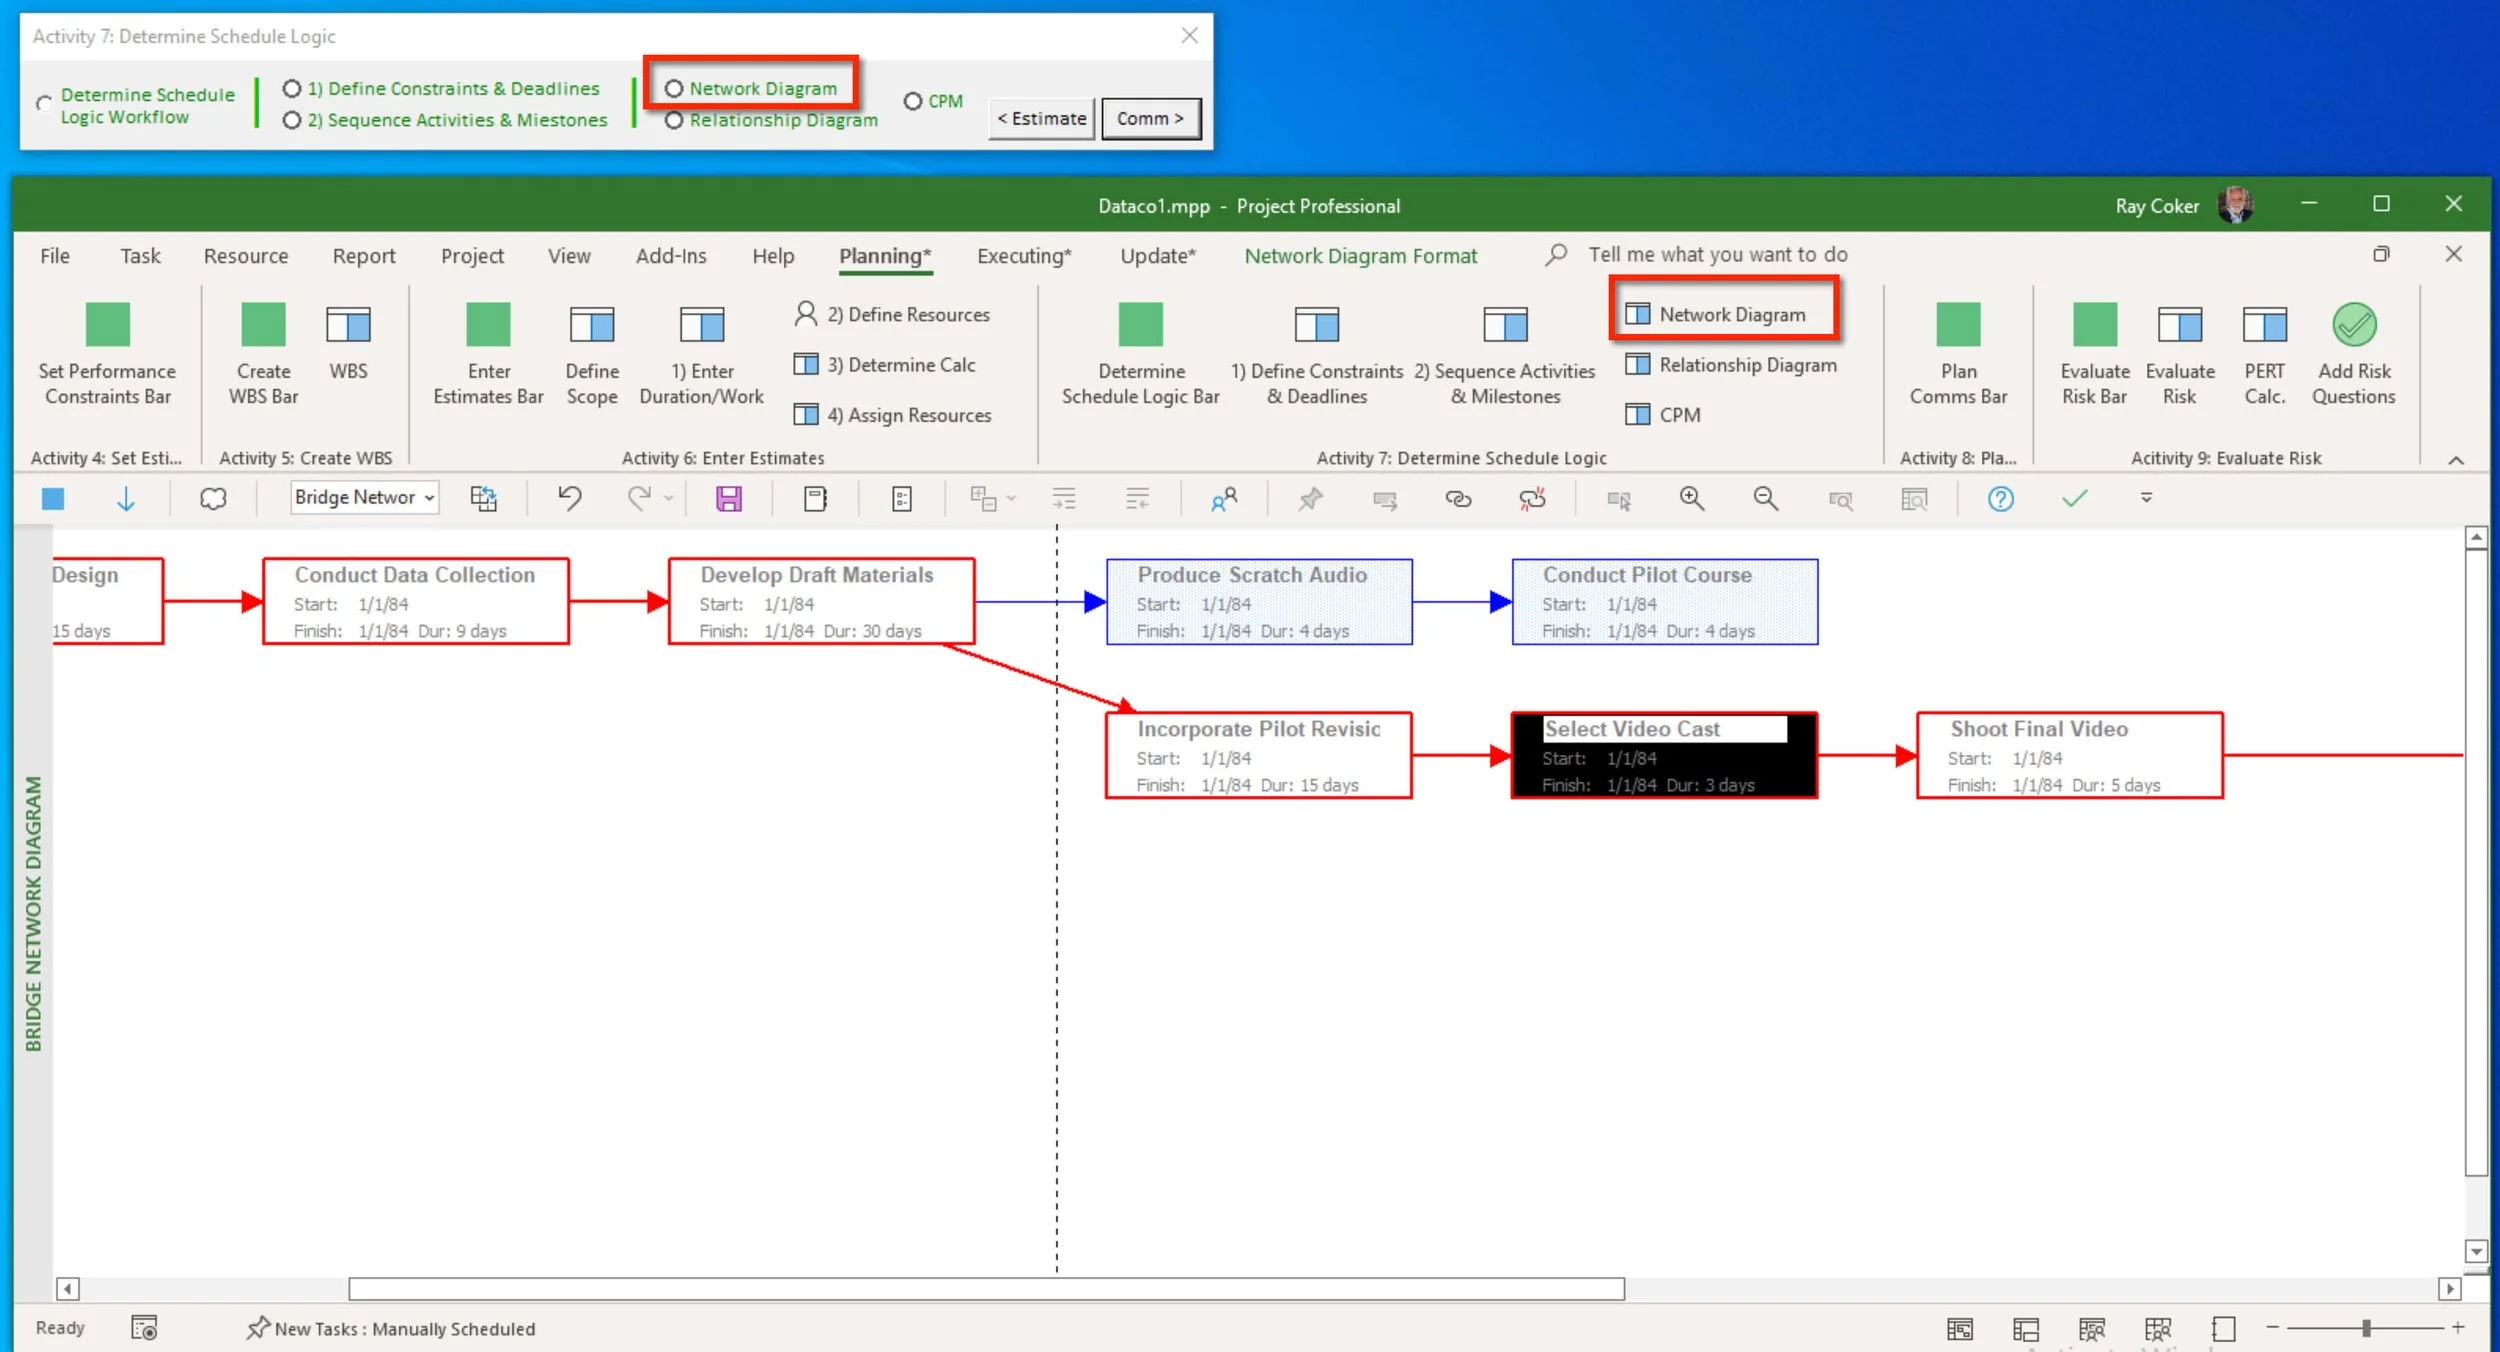
Figure 51. Network Diagram.
Click the Network Diagram View command.
A Network Diagram View is applied.
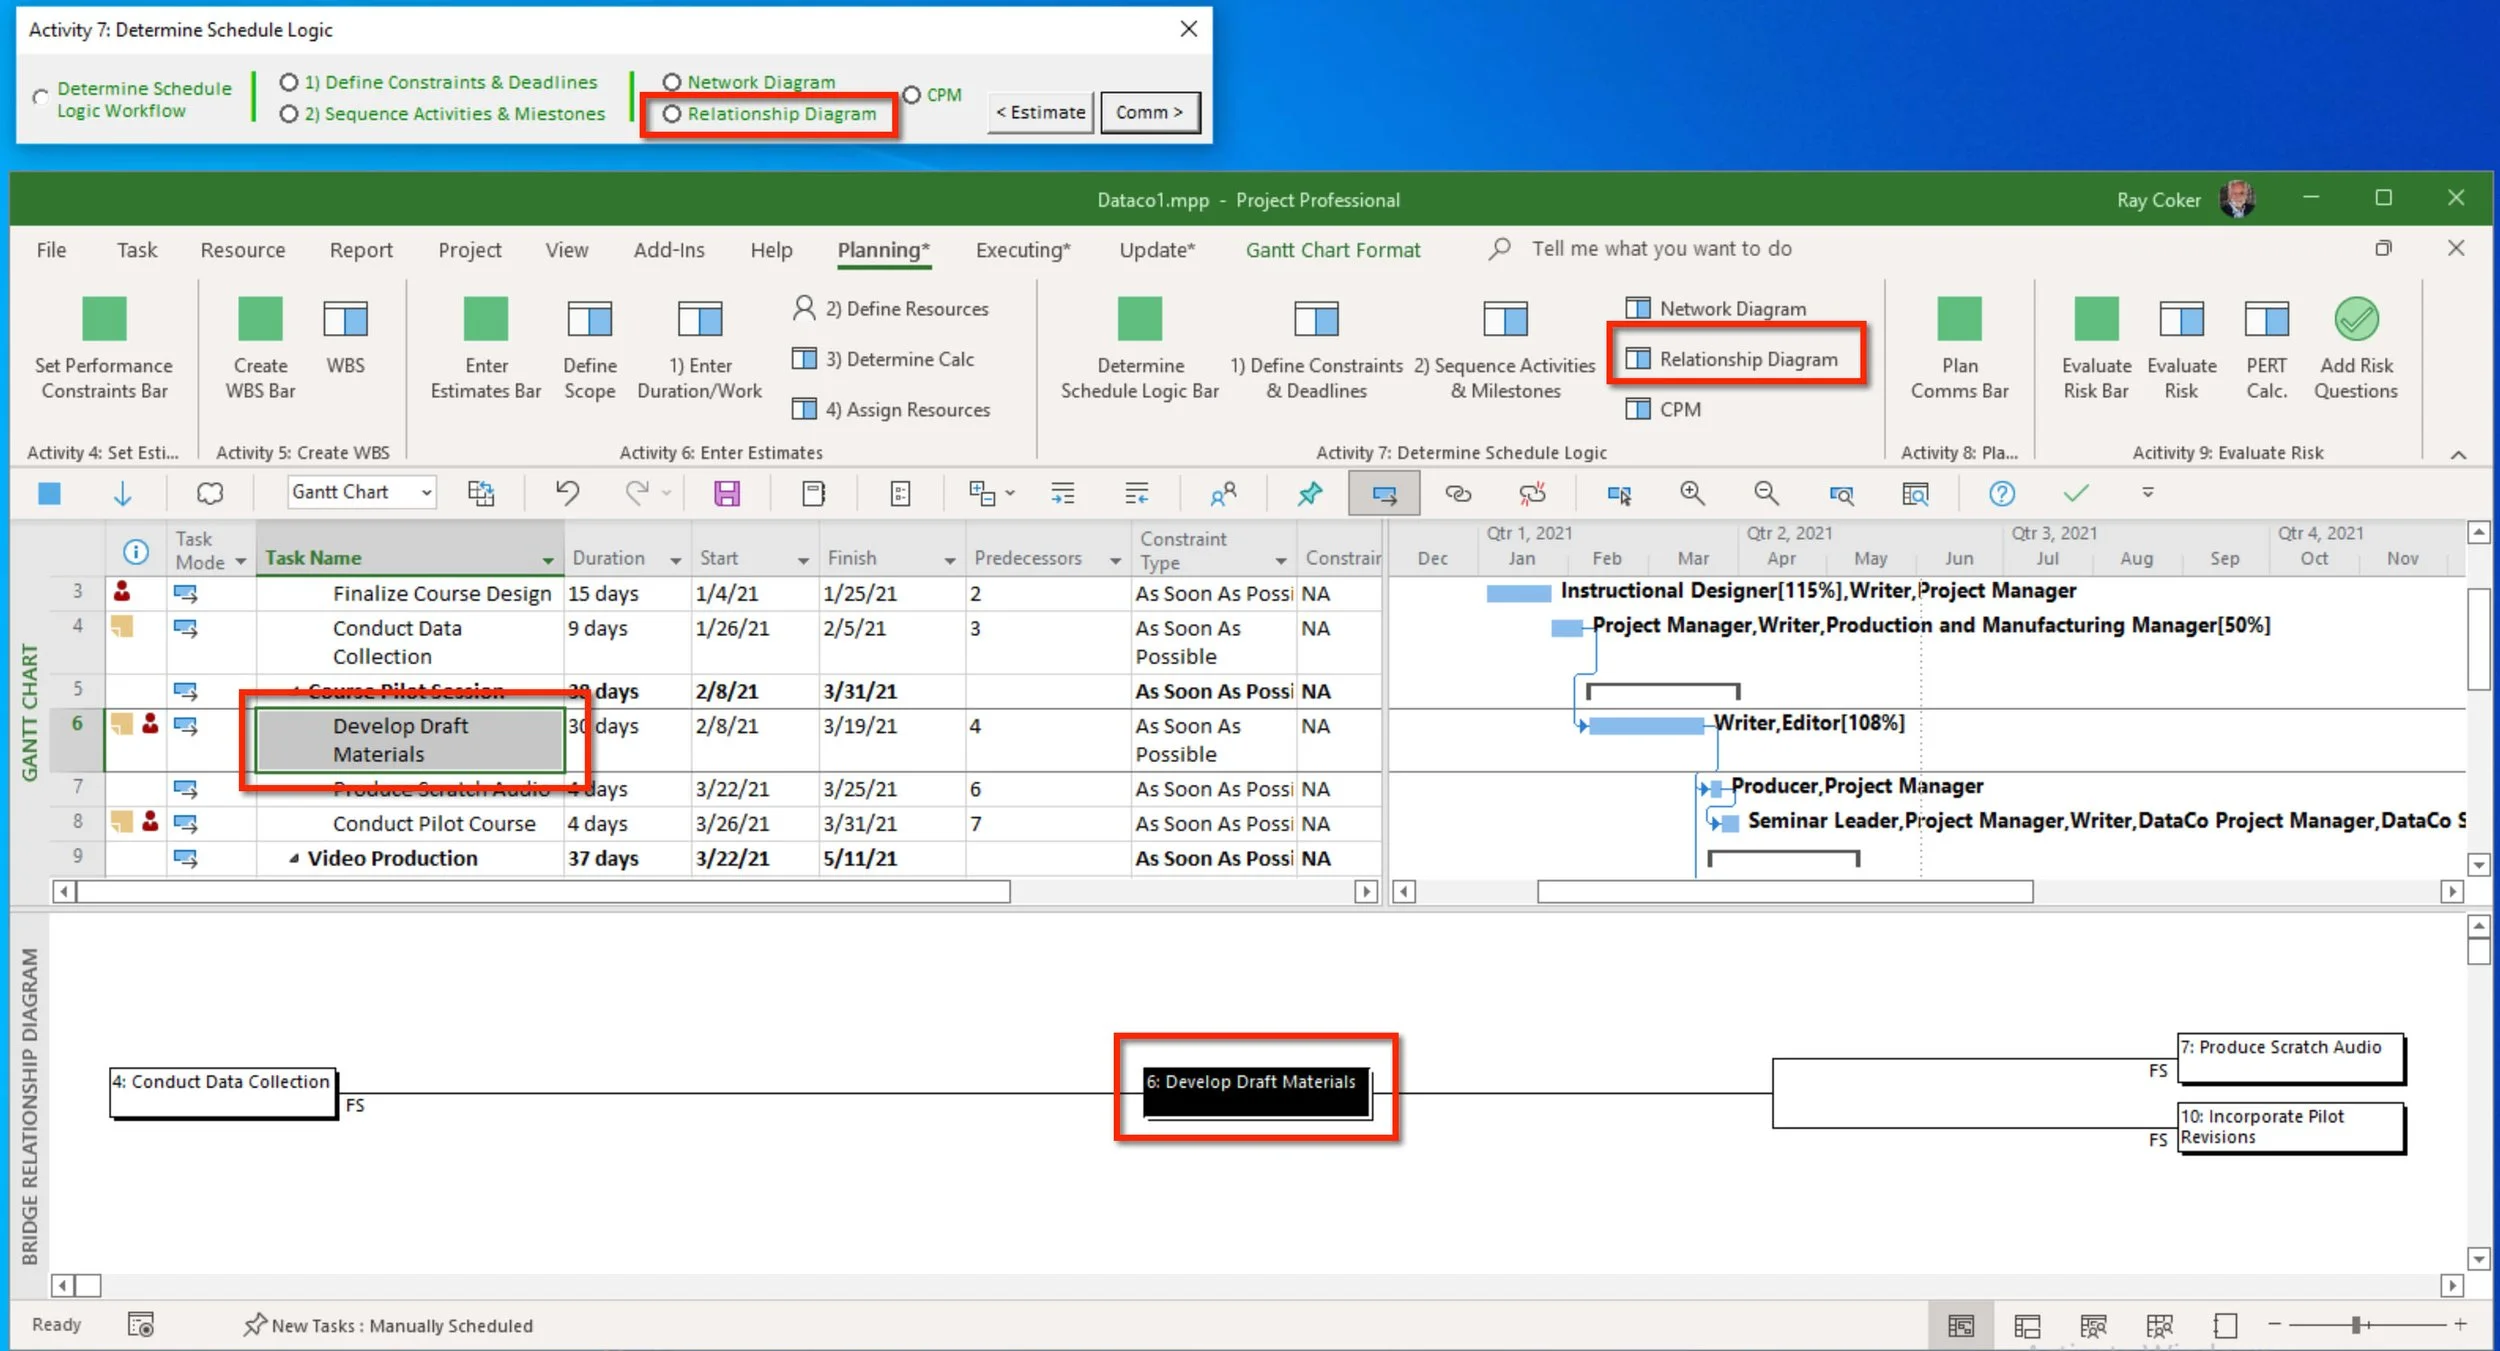
Figure 52. Relationship Diagram at the bottom of a split window.
Click the Relationship Diagram command.
The current window is split and the Relationship Diagram view is applied to the bottom of the split window. For a selected task in the top window, the predecessor and successor relationships are displayed in this view.
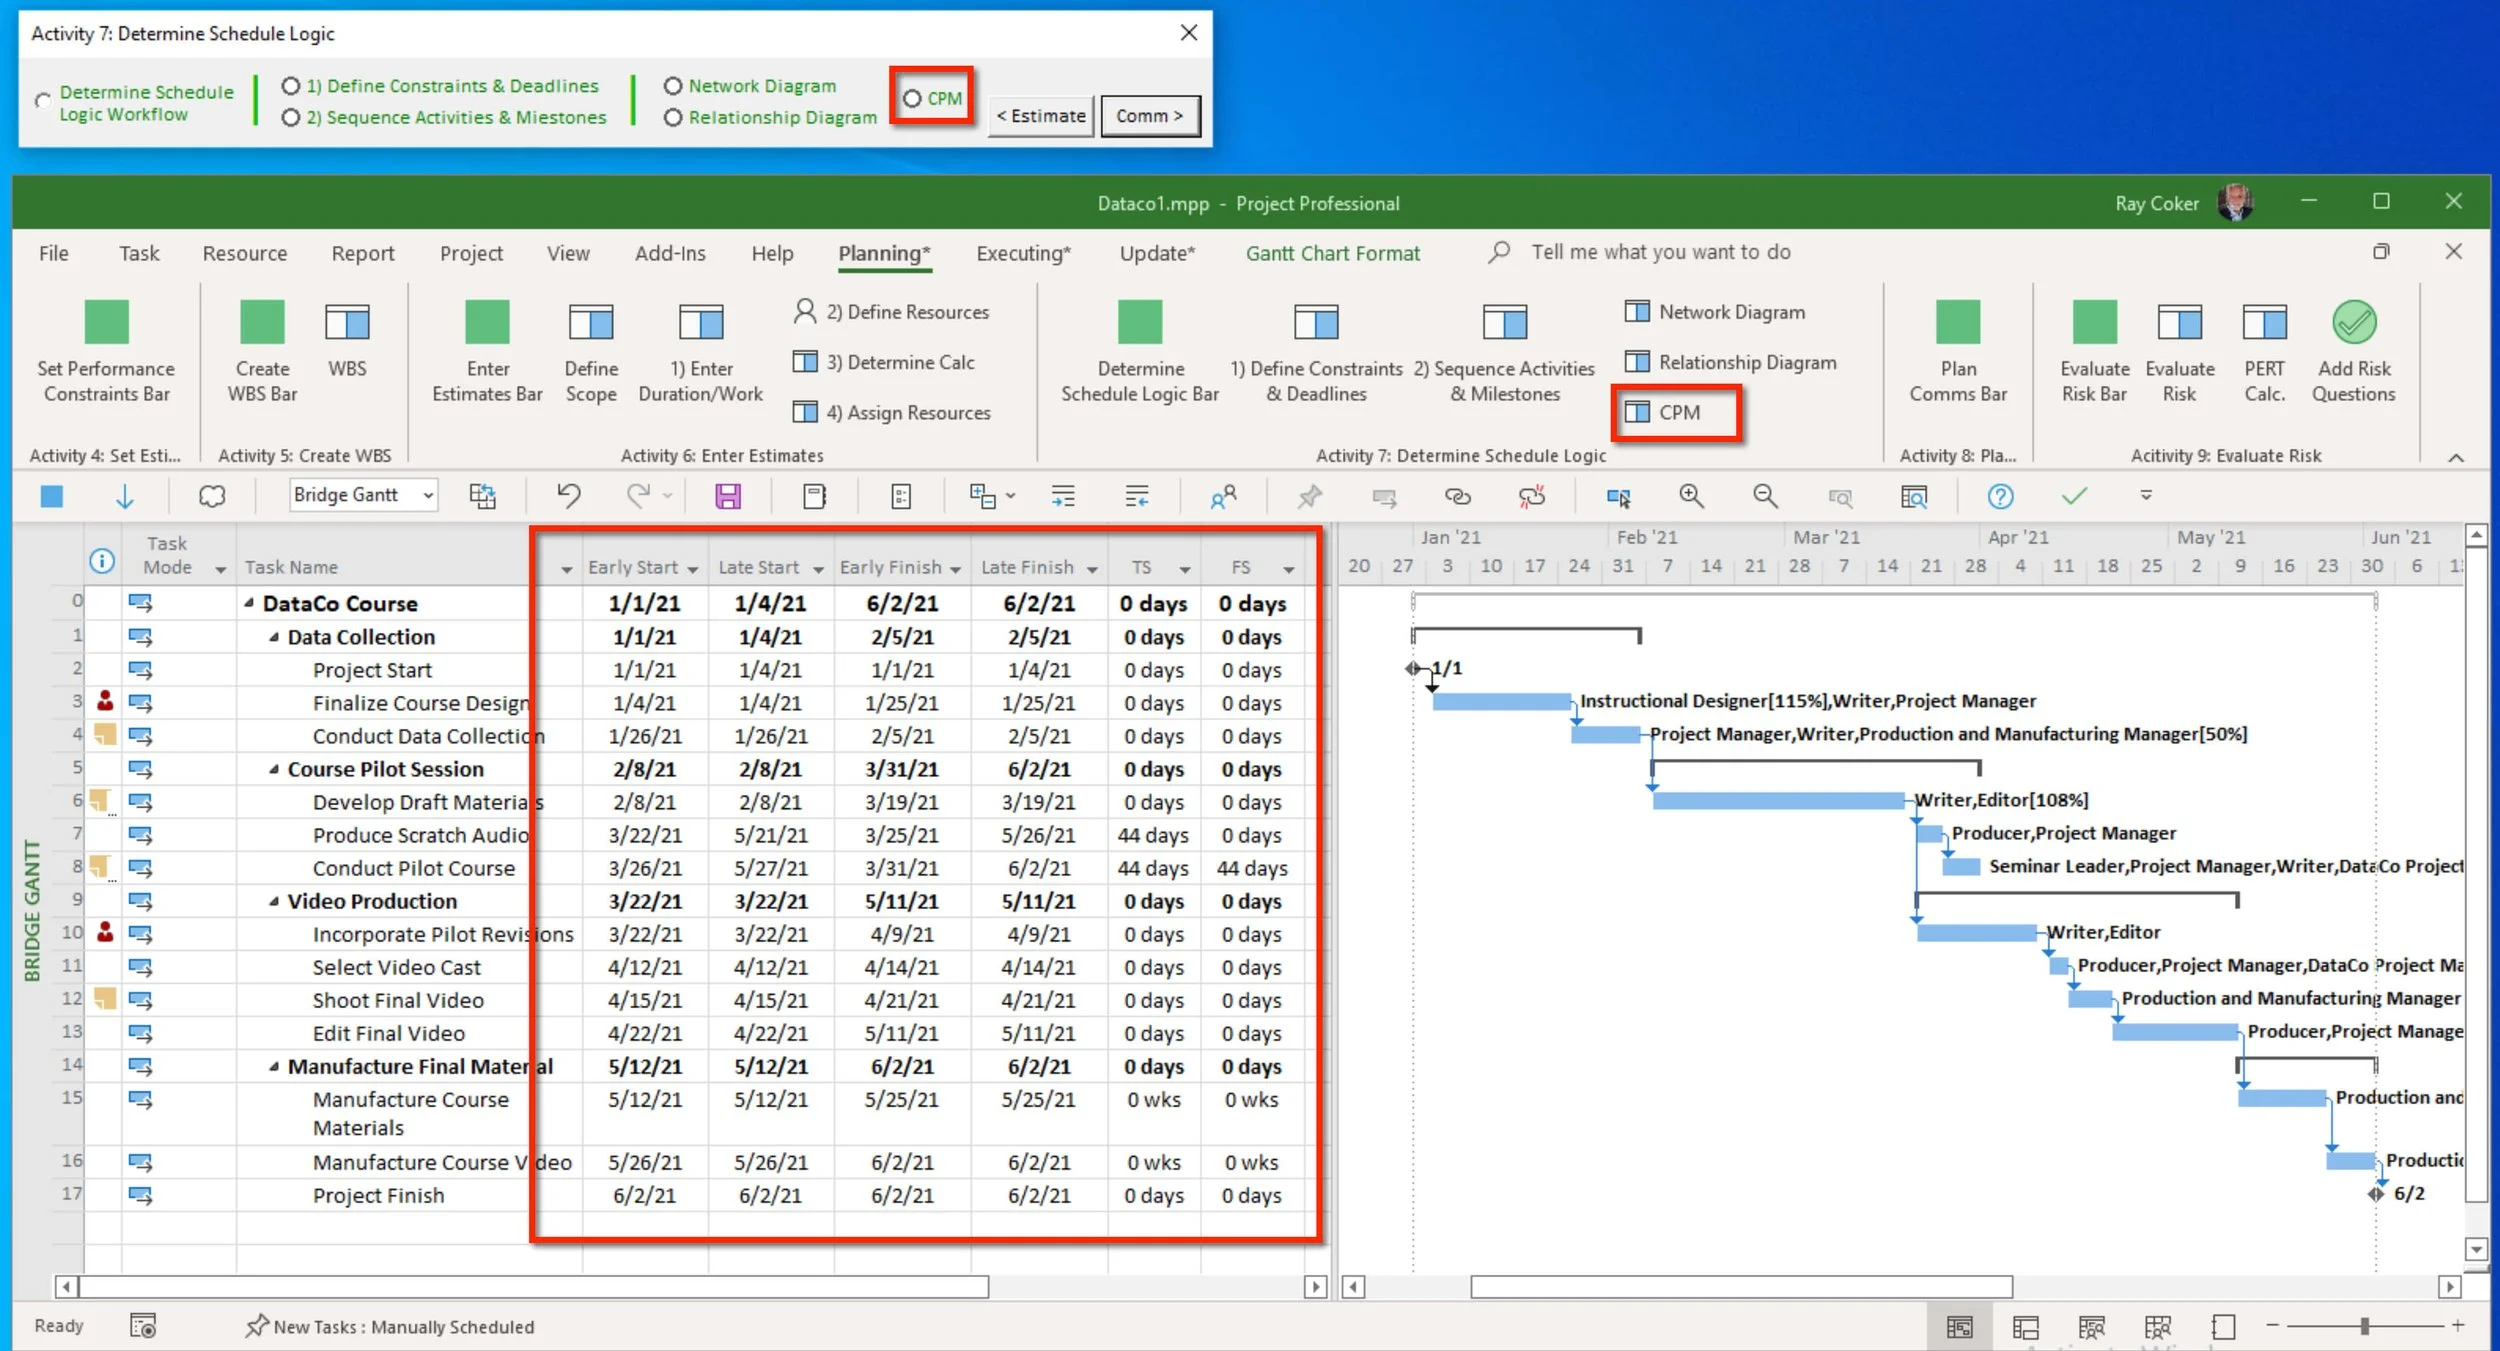
Figure 53. Critical Path Method calculated fields.
Click the CPM command.
A Gantt Chart view is applied with a table showing the following Critical Path Method calculated fields:
Early Start
Last Start
Early Finish
Late Finish
Total Slack
Free Slack