
Last Updated: March 20, 2022

Activity 8: Plan Communications
Page Outline
Application 4 - Create Visual Reports and Copy Picture (jump to)
Visual Reports Simulation - 30 minutes (jump to)
Copy Picture Simulation - 30 minutes (jump to)
Review of Best Practices (jump to)
Activity 8: Plan Communications Exam - 8 minutes (jump to)
Simulation Files (jump to)
Process Bridge Review - 15 minutes (jump to)
Application 1 - Learn Plan Communications Workflow
Activity 8 Workflow Simulation - 15 minutes
Plan Communications Content Links (jump to)
Application 2 - Learn Microsoft Project’s Database Organization (jump to)
Field Identification Simulation - 20 minutes (jump to)
Application 3 - Print Views & Standard Reports, and Create & Edit Reports (jump to)
Print Views Simulation - 20 minutes (jump to)
Create and Edit Standard Reports Simulation - 30 minutes (jump to)

Learn Plan Communications Workflow
Review
Review and learn Activity 8: Plan Communications workflow below.
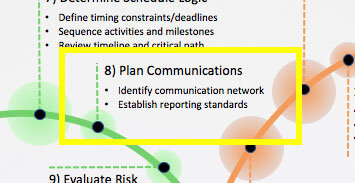
Figure 1. Activity 8 in Project MAP.

Note: This is Activity 8: Plan Communications in the Project MAP project lifecycle.
Perhaps the oldest human activity studied has been communication. Certainly, in ancient philosophy and the early origins of Western Civilization, communication has been viewed as one of the primary arts. All communication experts, then and now, agree that good communication doesn’t just occur, rather effective communication needs to be planned, developed, and presented.

Download *.docx
One way to plan formal project communication is to network or plan out the communication. The Communication Network v6.docx can be downloaded to help develop a communication and reporting network.
Project Example
The very hardest thing I have ever tried to accomplish in project management is trying to figure out what reporting management wants, and then once I have an idea of what they want to see, trying to figure out how to pull that information from the available data.

Journal
A colleague, who had a background in rolling out change in organizations, would assemble all the related managers on a project and ask them what they wanted to see each week, related to the people they had working on his project. He believed that on most projects in weak matrix organizations, managers influenced the performance of the people working on his project more than he ever could. Eventually, he would assemble the reports and get the managers together again, and would ask, “If I can give you this information each week, that you have asked for, can you do something for me?” “I am going to ask your people to status their work on activities, and enter estimates of work remaining, by the end of business each Friday, I will give you a list of who does and who doesn’t update their work the following Monday morning, can you encourage your people to do this simple update each week?”
In this example, this colleague focused on communicating effectively with management to encourage them to ensure that their direct reports assigned to his project would update their assigned work each week. Asking team members to status or update their work each week is one of the primary techniques used to keep people’s focus and commitment to get things done as scheduled. Anyone who has ever asked a group of people, that do not directly report to you, to perform this simple task of updating their work each week, knows from experience what a challenge this is. Once he established this communication, he would shift to figure out what specific communication project stakeholders needed. Eventually, he would approach the team members and ask them what they wanted to see each week.
His workflow is a bit different than the one presented in this Activity.
Can you think of a better workflow for Activity 8: Plan Communications when planning your communication or reporting? If yes, what is that workflow?
Do you currently plan out your formal communication network a priori or is it more ad hoc?
Can you think of a better workflow for Activity 8: Plan Communications when planning your communication or reporting? If yes, what is that workflow?

Best Practice
Group stakeholders, rank, and plan communications.
For each communication, list receivers, senders, information, schedule, and format.
Conduct a dry run to confirm that all stakeholders get the reporting they want and when they want it.

Activity 8 Workflow Simulation (15 minutes)
Open your MS Project Master Class Plan.mpp.
The reporting requirements for a project are often developed post hoc, however, developing a communications plan during the planning process will influence how that plan is built to ensure every stakeholder gets the communication they want and need.
There are four categories of reporting in Microsoft Project. Ten of the 17 types of views can be printed as reports. Select a Gantt Chart view, and then select File / Print and you will see a print preview.
For standard Microsoft Project reports, select the Report tab on the ribbon / and then in the View Reports group, select the Custom or Recent command. There are nine categories of reports available.

Figure 2. Standard Reports in Microsoft Project showing the nine categories of reports.
Click on the Work Overview report and the report is applied just as if it was a view. When a report is applied the Design tab on the ribbon appears, use this tab to edit the report. For instance, click on the Page Breaks command and likely the report is two pages. This report could easily be edited to fit on the page using a common office printer.

Note: Standard Reports are not views, but they are applied to the window just like a view. For instance, the window could be split with a view on the top pane in the window and a report in the bottom split of the window. Use the Organizer to manage Reports, just like Views, Tables, Filters, Groups, etc.

Figure 3. Design tab on the ribbon and the Work Overview report.
Visual Reports
Another type of report in Microsoft Project is Visual Reports, which essentially are export multi-dimensional data from the project to Excel or Visio.

Download *.mpp file
Download the Datatco Visual Report.mpp file using the download icon above and open in Microsoft Project.
Select Reports on the ribbon and then the Visual Reports command. Reports are listed in seven categories. In the All tab select the Resource Work Summary Report and select Weeks for the usage data for the report. Finally, select the View button.

Figure 4. Visual Reports.
The report is based on an existing template formatted with shades of gray. That is easily changed by selecting the Excel Format tab on the ribbon, selecting a value bar in the report, and selecting a fill color.
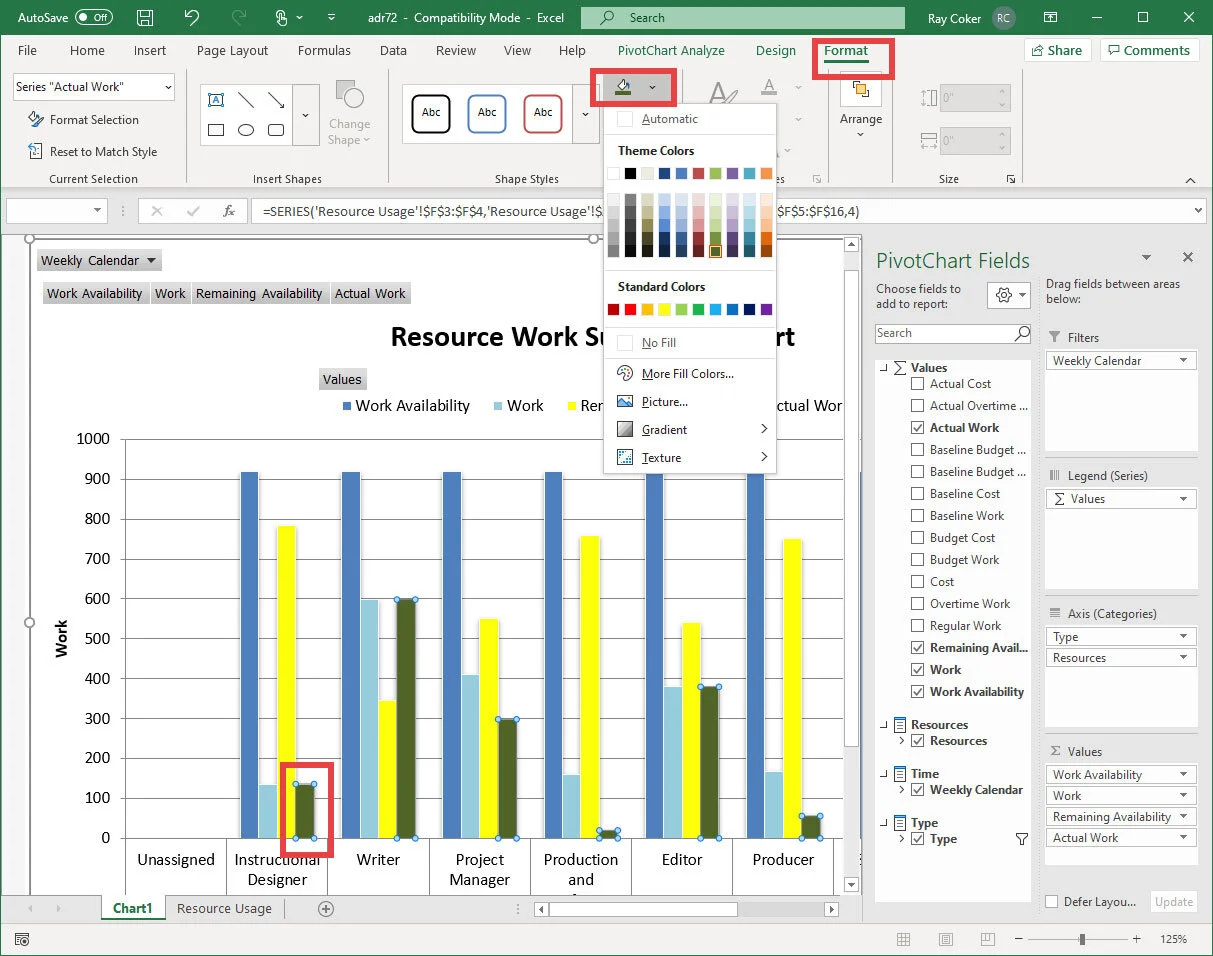
Figure 5. Editing a Visual Report in Excel.
Copy Picture
The last reporting functionality we will review is Copy Picture. Copy Picture, much like screen capture tools, can be a handy little reporting tool.
Find Copy Picture under the Task tab / Copy / Copy Picture. The best aspect of this screen capture is being able to select tasks that do not appear on the screen and a date range for the timescale taskbars.
Project Example
Typically, when we write a proposal for a Project Server deployment we include a project plan that is about 75 tasks. Even though that number of tasks exceed what is visible on the screen in a Project Gantt Chart view, we can select all of the tasks in the plan, Copy Picture and then paste the picture right into our Word proposal document, resize it so that it fits on one page and is still readable, or at least zoomable when read as a PDF by our customer. Copy Picture does a better screen capture better than any capture program we have used.
For instance, it took less than 2 minutes to download a Microsoft template, zoom the entire project timescales, hide a couple of columns, select all of the tasks, Copy Picture as gif, open the file in Photoshop to reduce the size for the web and upload the figure below. Copy Picture is a handy reporting tool. The Timeline view and the traditional reports have their own Copy Picture tool.

Figure 6. Copy Picture example.

Figure 7. Copy Picture dialog box.
The last part of the workflow is to Confirm Reporting Output and Schedule. Test it, make sure everyone is getting what they want. Many large capital projects bog-downed early in deployment because the reporting hasn’t been tested and confirmed.
Project Example
If your business is associated with the project plan centers around weekly reporting, for instance, it isn’t a bad idea to develop a risk plan for those reports. For instance, CP Ships ran one of the best Project Server deployments I have seen for their 500 person IT group across 20 locations around the world. The percentage of people that were accounting for all time, both project time and administrative time, was a high 96% and all their 25 project managers were keeping up with the weekly reporting cycle. They had also done a great job confirming the reporting output and schedule. They lived by those weekly SQL OLAP Cube reports and some of the reports functioned as their timesheet system. Both project managers and line managers depended on those reports each week. Then one day a Microsoft service pack was applied (SP2) and it broke those reporting services. It was weeks before a fix was developed and it threw a serious wrench in the works.
Before leaving this simulation, select your MS Project Master Class Plan.mpp file and using the Outline above and the Table of Contents in the Master Class Book, create WBS, enter duration estimates, set the links, etc., make sure the project is current all the way through Activity 8.
Update the WBS
Enter Duration Estimates
Assign yourself to all Detail Tasks
Set Standard Dependencies between all Detail Tasks.
Save your project.
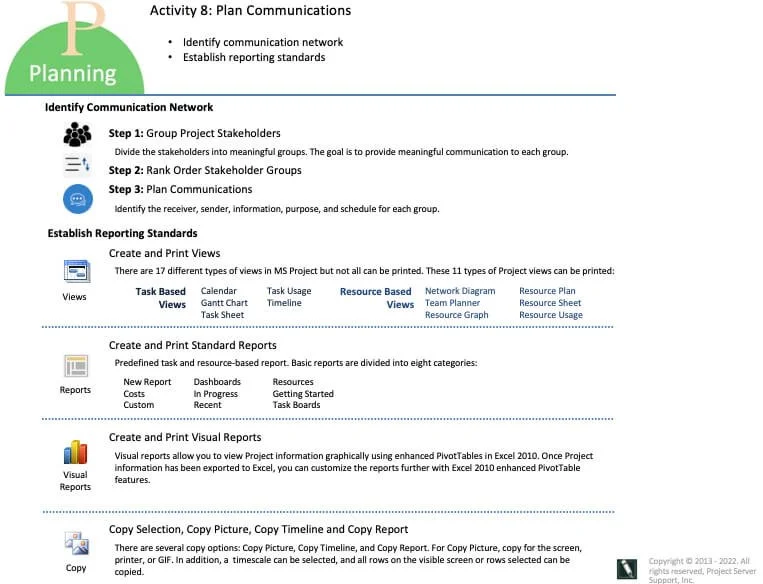
Figure 8: Plan Communications Workflow chart.

Download chart as PDF

Return to the Master Class Book and review the next section for this Activity.

Learn Microsoft Project’s Database Organization
It is important to have a good understanding on how Microsoft Project organizes data before designing your reporting. Download these two posters and review them.
One side of the poster reviews the various views and lists out and categorizes the eight types of fields. The other side provides an illustration of the eight different Work fields.
The Microsoft Project Organization Posters A and B are designed to help you get a bird’s eye view of Microsoft Project’s organization or database structure. A basic understanding of this data organization will better help you not only in reporting but when working with Microsoft Project.
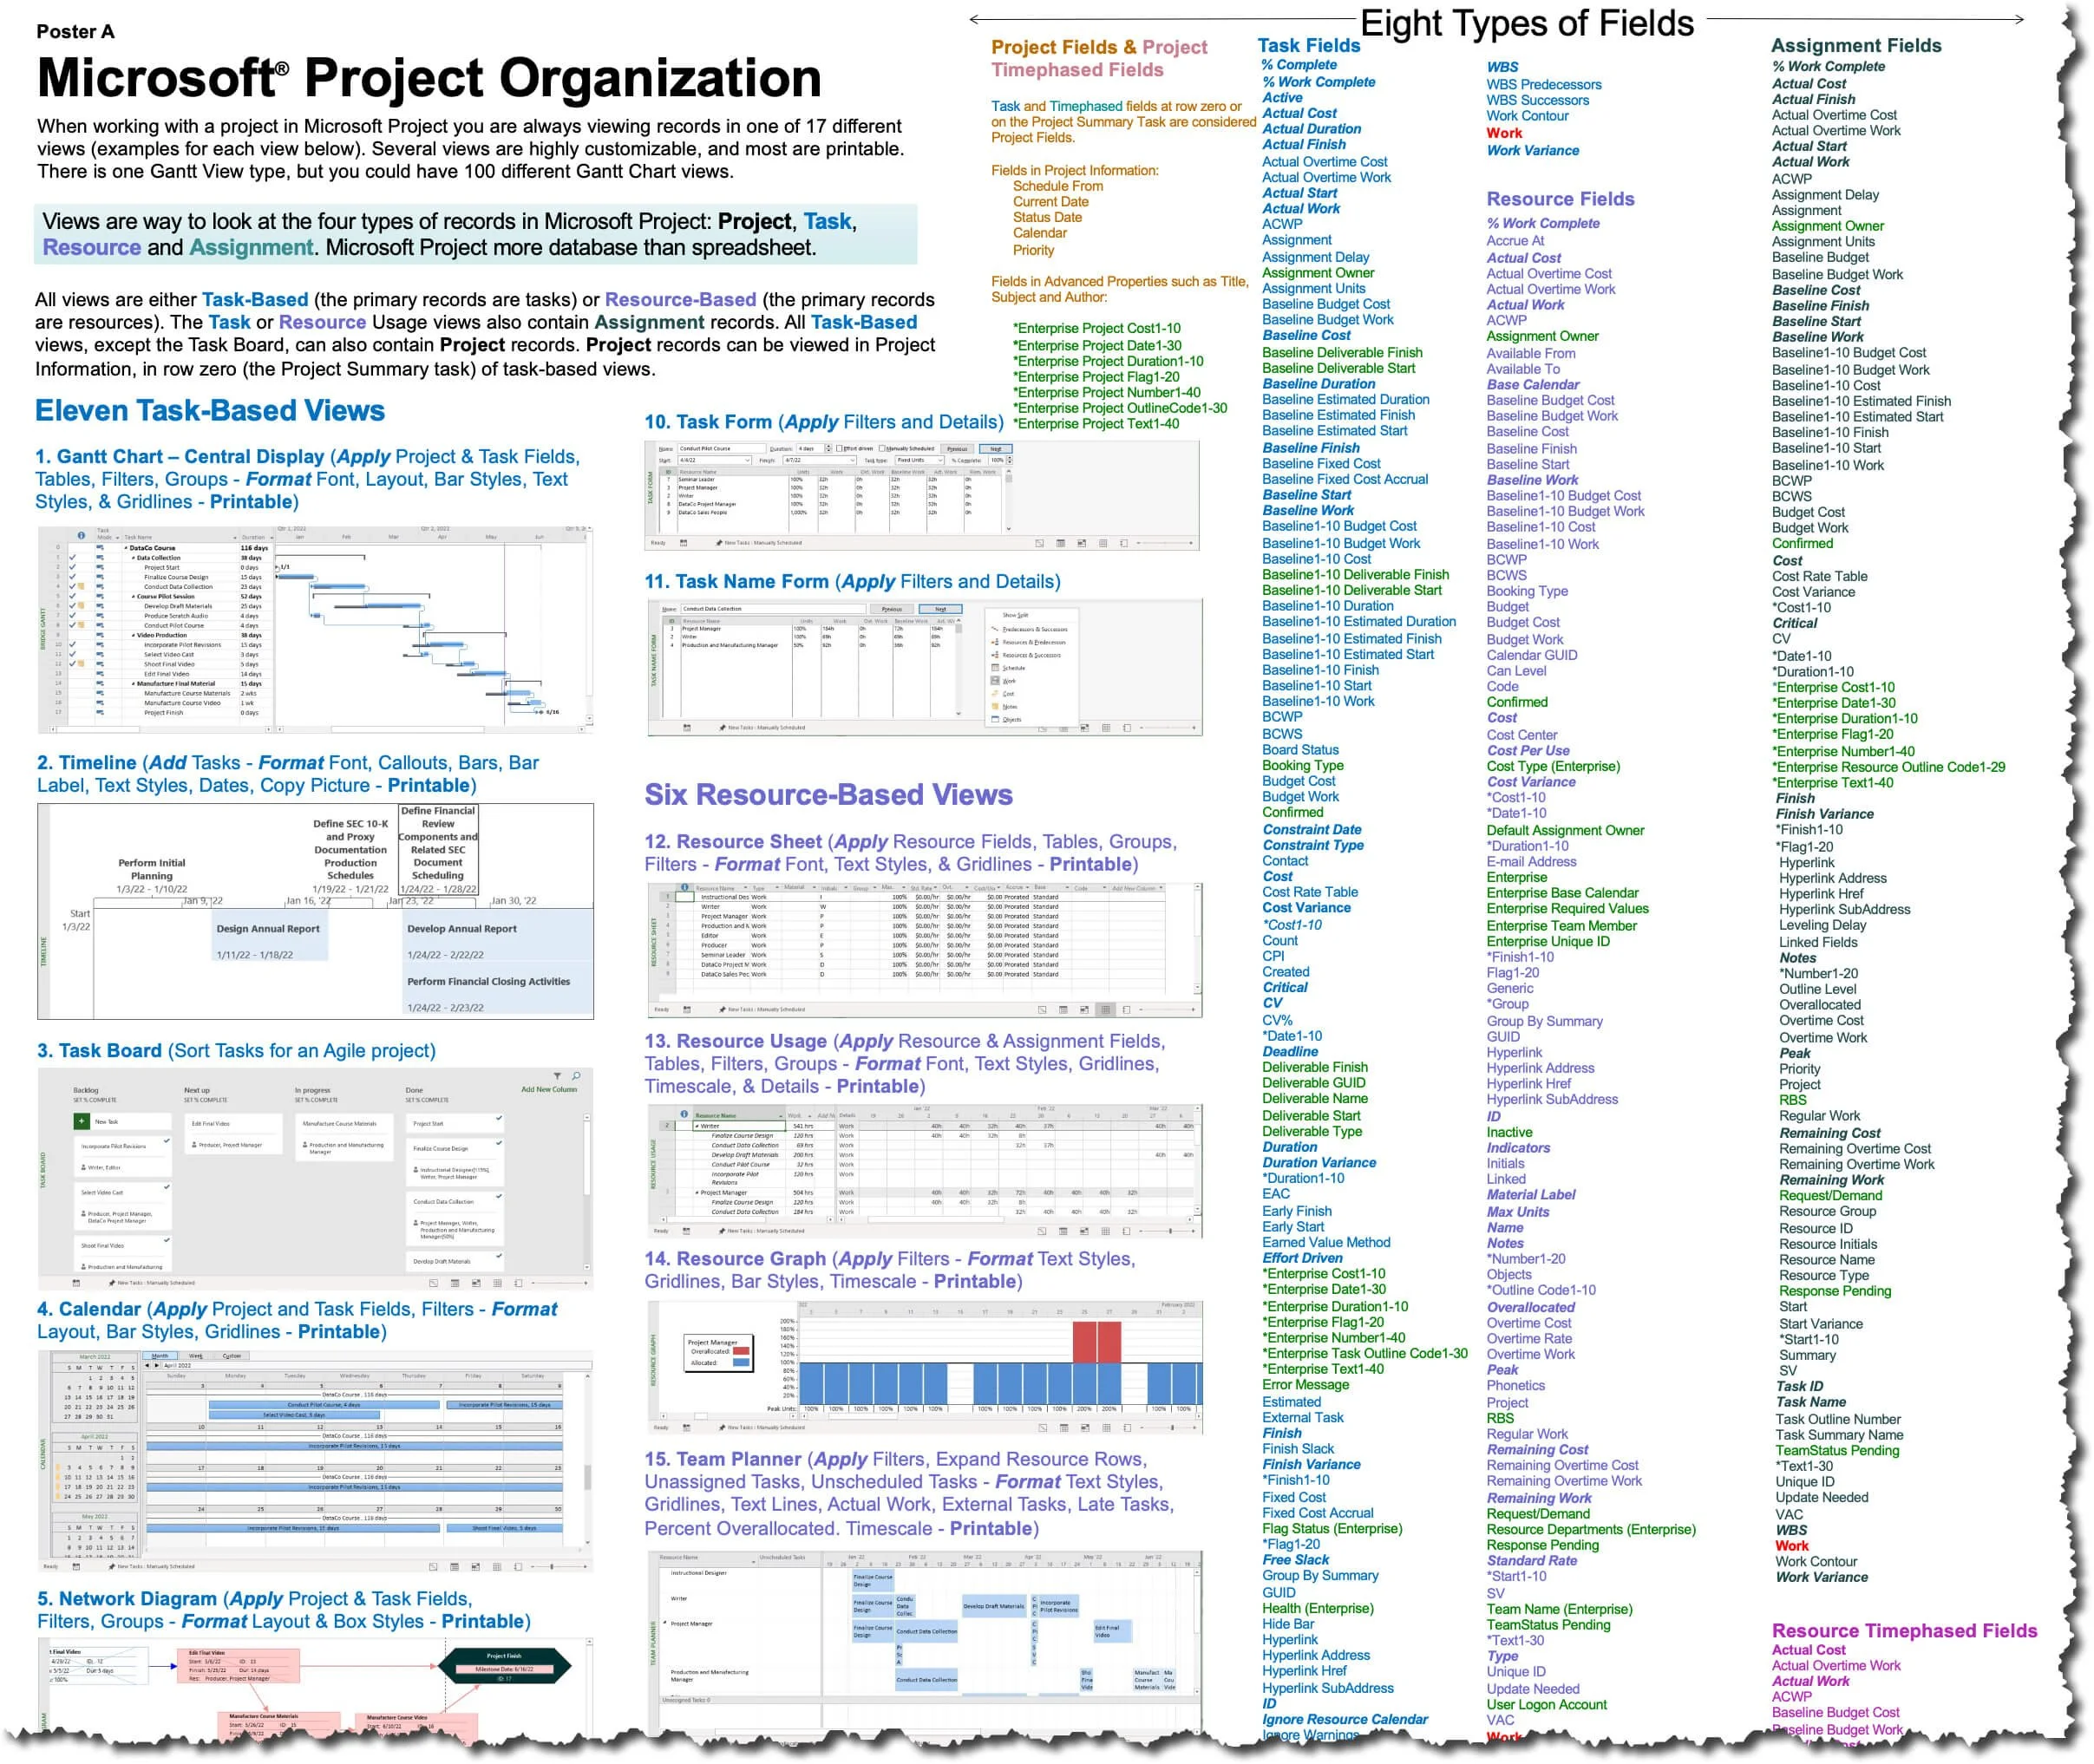
Figure 9. Microsoft Project Organization Poster.

Download poster as PDF

Field Identification Simulation (20 minutes)

Download *mpp file
To start this simulation, download the Work.mpp file by using the icon above and open it in Microsoft Project. Rename the file to 8 - 1 Work.mpp. Make sure your global settings in Project Options are correct and that you are using Microsoft Project 2019 or 2021 for best results.
Apply the Task Usage view. Zoom in the timescale to days and move to Friday right before March 21, 2021, as shown below.
There are six different Work fields shown in this view. Open the Notes for the Project Summary task and identify each field that is marked A - F in the figure below.

Figure 10. Work fields in a Task Usage View.
Apply the Resource Usage view. There are four different Work fields displayed in this view. Zoom the timescale to daily and move to the same Friday.
For each of these Work fields, A - D, marked in the figure below, describe what they are and what they tell you. Enter this information in the Assignment Information Notes field for the Project Manager on the Select Video Cast task.
Save the project when you are finished.

Figure 11. Work fields in a Resource Usage view.

Journal
If you boil down the database in a Microsoft Project file to the primary types of data included in that database, what data are we talking about?
Explain in your own words what this statement means: “There are four types of records, or objects, in Microsoft Project: Project, Task, Resource, and Assignment. Microsoft Project is more like a database than it is a spreadsheet.”
What does it mean that all views in Microsoft Project are either task or resource-based?
Do you think it is worthwhile to memorize certain things about the software in a software tool like Microsoft Project?
The answer is yes if you want to be fluid with the app.
We already know that Microsoft Project is a multi-dimensional database tool. If you could put your project in the middle of a room, and you wanted to walk around it and look at it from multiple perspectives, how would you do that?
You do this by applying the different types of views. (We created the Microsoft Project Organization Posters.pdf as a poster or flip chart size to help you conceptualize the different kinds of records, views, and eight types of fields. On one side, Poster A: Microsoft Project Organization illustrates the 17 different kinds of views and the eight types of fields. This poster can be printed out on a plotter in the office or a place like FedEx Office. We recommend hanging this poster in your office until this Microsoft Project database organization becomes intuitive.
3. From memory, can you list out most of the task-based views?
4. From memory, can you list out most of the resource-based views?
5. There are eight types of fields in Microsoft Project; can you identify each one?

If you are working with a coach, save and email them this file, 8 - 1 Work.mpp to review. This file should have the appropriate notes in two different Notes fields as directed. If are planning to apply to either MS Master Class certificate, archive this completed simulation file so that you can submit it for review.

Return to the Program Book and review the next section for this Activity.
Content Links

Traditional or Standard Reports are reports in standard report format like 8.5 X 11.
Out of the Box Reports – Twenty-six pre-created and customizable reports come with Microsoft Project. These reports are under Dashboards (5 reports), Resources (2 reports), Costs (5 reports), In Progress (4 reports), Getting Started (5 reports), and Task Boards (5 reports) that are used for Agile project management.
These reports are highly customizable. These or new reports are:
Dynamic, meaning the report is updated when there is a change to the project.
Easily used with other projects and shared with other users.
Treated like a Microsoft Project view and can be applied to a split window with either a view on either the top or bottom split of the window.

Best Practice
Use the Organizer to manage reports.

There are 17 views in Microsoft Project and ten of these can be printed. The most common views to print on a plotter is a Gantt Chart, Task or Resource Usage views, or the Network diagram view.

Best Practice
If a view is going to be printed during each update cycle, create a new view just for printing so that it does not need to be re-formatted for each WYSIWYG print.

Visual Reports are export routines that export six types of data to Excel or Visio. You can also Save Data (export the project) as an OLAP Cube or Microsoft Access Database file.
There are six categories of reports and 20 reports (Excel Templates) that come with Microsoft Project.

Copy Picture is a capture feature in Microsoft Project that is significantly better or complements most capture programs.
This capture feature is available for these views:
Gantt Chart view
Timeline view (this view has a slightly different Copy Picture command)
Network Diagram view (limited GIF)
Task Usage view
Task Sheet view
Resource Sheet view
Resource Usage view
Resource Graph view (limited GIF)
Copy Report and Copy Timeline are also available for Traditional reports and the Timeline view.

Print Views & Standard Reports, and Create & Edit Reports
Review
Review the Content Link above on Printing Views. (jump to)

Print Views Simulation (20 minutes)

Download *.mpp file
To start this simulation, download the Printing.mpp file by using the icon above and open it in Microsoft Project. Rename the file to 8 - 2 Printing.mpp. Make sure your global settings in Project Options are best suited for this simulation and that you are using Microsoft Project 2019, 2021, or Windows 365 with updates applied.
Let’s suppose you want to print a report on resource work. A line manager has requested a report for each resource’s work, actual work, and remaining work on your project and they would like to see that information cross-tabulated for just the second quarter.
Apply the Resource Usage view.
Next, since printing a view in Microsoft Project is a function of WYSIWYG, let’s set up the view for the report.
Since the manager is only interested in work, filter out the other non-work resources by applying the Resources - Work filter. This filter comes standard with Microsoft Project. Select the View tab on the ribbon / Filter / Resources - Work.
The Unassigned category is still showing. To filter this out, click on the drop-down arrow (AutoFilter) next to the Resource Name column header. Uncheck, Unassigned, and the two tasks that have no resources assigned Project Start and Project Finish. If the AutoFilter isn’t showing, select View / Filter / Display AutoFilter to toggle on this filter feature.
You can also sort data in the column by using the AutoFilter. Sort Resource Names A to Z.

Figure 12. AutoFilter.
Hide the Indicators and ID fields (Hide Column) from the table, and after Resources Names, add the Work, Actual Work and Remaining Work fields. Remove the rest of the columns by selecting the rest of the columns in the table, right-click and Hide Column. The ID field is locked in, to hide, edit the table and remove, and uncheck Lock first column.
Best-fit the first four columns, Resources Name, Work, Actual Work, and Remaining Work. Center the data in the Work, Actual Work, and Remaining Work columns.
Next, set up the timescale. The manager requested to see the work values on a weekly basis. Select the View tab on the ribbon, then zoom the Entire Project and then select Weeks in the Timescale dropdown. The timescale should show Months and then Weeks. If not, move your cursor on the timescale, right-click, select Timescale, and in the Middle Tier tab select Months, and in the Bottom Tier tab select Weeks.
Work details are already showing in the timescale, to add Actual Work and Remaining Work, click Resource Usage Format on the ribbon, add the timephased Actual Work by checking the Actual Work command in the Details group. Remaining Work is not listed, click the Add Details command and scroll the list of available timephased fields on the left. Remaining Work is not available! Double-check the Poster A - Microsoft Project Organization that can be downloaded above, and notice that Remaining Work is not available. In addition, there are no timephased custom columns available in Microsoft Project so that field can not be customized. There is however a Remaining Cumulative Work field available. Add that field instead.
Microsoft defines Remaining Cumulative Work as:
“Remaining Cumulative Work = Total Work – Cumulative Work
Best Uses Add the Remaining Cumulative Work field to the timephased portion of the Resource Usage view to review remaining cumulative work information for a resource. This allows you to see how much total scheduled work remains to be completed for a resource at a given point in time.”

Tip: When looking for a particular field, resist the urge to say, “Damn, it isn’t there!” Search the chart used above or search online with something like “Microsoft Project available fields.” Likely, the field is named differently than you thought, or there is a field that might even work better for you. You can also give Microsoft support a shot. I am currently in a conversation with senior engineer, Mr. Raymando Rayappan, and he as been delightful and most helpful. He reached out to me based on a question I had asked in online chat session at Microsoft 365 support.
While in Add Details, make the cell background of Work bright yellow and Remaining Cumulative Work a light blue or grey.
If you do not have All Assignment Rows in Add Details, show this field. In a Usage view, there are several types of records. In the Resources Usage view, the two primary records are Resources and Assignments. The All Assignment Rows field allows you to break these out visually in the timescale area. Make sure you are showing this field and make the background a very light green.
Simulation Results
So far, your screen should look similar to the one in the next figure.

Figure 13. Simulation results, Resource Usage view sorted by Resource Names.
This view is almost ready for printing. To print preview, select File / Print. Print preview is the next screen. There you can select your printer driver, edit a date range to print, and make selections in page setup.

Note: What you see is also a function of the printer selected. In this example, an HP LaserJet Pro is selected.
Print only the second quarter date range, so set the Dates to 4/1/2021, through the end of the project or 6/9/2021.
Select Page Setup and complete the following:
On the Left side of the Header, Add the Project Current Date from the General dropdown menu. Underneath that line, type in Resource Work Report and make it bold and dark blue.
On the Center of the Header, Add Work and then Actual Work on the next line. Type in the label for each field before the & symbol. Like this: Work &[Work], otherwise only the data will show and the reader may not know what it represents.
On the Right side of the Header, Add % Work Complete and Remaining Work, and type in a label for each field.

Figure 14. Page Setup in MS Project.
Remove the Borders in the Margins tab.
In the View tab, uncheck every item.
Play with the Zoom on the Page tab and see if you can adjust the report to being no more than 3 pages but still legible.
Save the project.

Figure 15. Printing views and making selections in Setting for the report.
What if you want or need to print the report as PDF?
There are two ways to do this, first, you can Export as a PDF file. In general, this is not the best solution. If you have a PDF printer driver listed under Printer, like Adobe or Microsoft Print to PDF, that is the best option. If you can print to a PDF driver, print this report and name the file 8 - 3 Printing.pdf.
Simulation Results
Your PDF file should look similar to the one below.
A - It is less than four pages.
B - Resource Name is sorted A - Z.
C - These fields are shown with the data, centered in the columns.
D - This date range is displayed.
E - These Details are included.
F - A similar color scheme is applied.
G - These fields and similar formatting and color schemes are in the header.

Figure 16. Printing to a PDF driver.

Best Practice
For Views that you print out routinely, create a custom view with all of the other custom elements associated with the view such as tables and filters and use those elements for just reporting. Consider naming the custom elements the same name as the report.
Page Setup for printing is saved with the view, so sharing views with other projects or users, also shares that setup.

Create and Edit Standard Reports Simulation (30 minutes)
Review
Review the Content Link above on Standard Reports. (jump to)
Review Chart 9 below on Standard Reports.

Figure 17. Standard Reports chart.

Download as PDF
Click the icon above to download the Standard Reports chart.

Download *.mpp
To start this simulation, download the Standard Reports.mpp file using the download icon above and open it in Microsoft Project. Rename the file to 8 - 4 Standard Reports.mpp. Make sure your global settings in Project Options are correct and for the best results you are using Microsoft Project 2019, 2021, or Microsoft 365.
Let’s suppose your company is developing this custom training program for Apple retail salespeople nationwide and you want to print a weekly report on resource work and the work and cost status for the major phases of your project. The people attending the status meeting want the report in 8.5 X 11 format.
Click on the Report tab, click the Recent command and open the Resource Overview report.
You had started this report last week when you were just going to report on work, but now people want work and cost status on the project so rename the report to Work and Cost Status. You can do that by going to the Organizer, or by clicking the Design tab, selecting the Manage command, and Rename Report.
Start off on the right foot by showing Page Breaks in the Page Setup group if they are not showing and make sure the report is in Landscape Orientation.
In the Text Box next to the Apple logo, type Work and Cost Status Report. Apple’s corporate colors are black and gray, so we will work with those colors so that the report has, say from our perspective, the look and feel preferred by the customer.
On the first page, there is a table including work information. Select the table and then add the fields listed below in the Table Data panel. Add them in this order:
Cost
Actual Cost
Remaining Cost
Cost Variance
As already mentioned, these tables are not easy to work with, it is best to predetermine the fields you want in the table and then add fields (columns) right to left.
Arrange the row and columns appropriately. In the Layout tab, there is a Cell Size group, but I have found manual adjustments often work best.

Figure 18. Adding fields to a table in Standard Reports.

Note: the undo and redo commands are available when working with these reports. If you mess up a table trying to adjust the cells, just click undo and try again.
The table is showing Outline Level / Level 1, and it is easy to see the variances in the Work and Cost Variances fields. In Microsoft Project, positive and negative are the opposite of the way we think about them when reviewing project status. A positive variance regarding cost, for instance, is actually a negative variance in most people’s thinking.
Since this project does not include a lot of tasks, in the Outline Level, show Level 2 and Show Hierarchy. This added detail tells a better story or provides a more complete explanation of status. Use the Table Design tab / WordArt Styles group / Text Outline command to highlight positive variances in red and negative variances in blue. You could also select the Task tab on the ribbon and use the Font group to highlight text.
It would be great to show the Project Summary task, but the table doesn’t fit well with that added level in the Hierarchy, so let’s add another table and just show the Project Summary. We are going to do this so that the Project Summary task is visible as shown in the figure below.
Select the table, Copy the table and then Paste. In the Outline Level, select Project Summary, and then in the second Design tab / Table Style Options, uncheck the Header Row command and arrange the two tables like the figure below.
Format the positive variances in bold red.
if Word Art has been applied to any of the fields, this may not be possible. Word Art can be cleared in the second Design table under the Quick Styles command.
Be sure the table, logo, and text box fit on the first page.
Simulation Results
For the file 8 - 4 Standard Reports.mpp, the first page of this report should look like the figure below.

Figure 19. Using two tables to show the Project Summary task and the project tasks to level 2.
In the next part of the report, you want to chart resource Work-related status and resource % Work Complete. These are two different types of data, so you will need two different charts. In addition, the current chart in the report is too busy. You will not be able to fit all of the resources on the same chart so you are going to place half the resources on one chart and the other half on the other.
First, size the chart to fit on the page. Then add a Text Box in the Design tab and title it Resource Work Status.
There are a lot of custom fields we could use to filter the resources into two different categories so they can be filtered for this chart, such as the Flag fields, but since the Group field is not being used and there is already a filter for Group, let’s use that field.
Go to the Resource Sheet view in Microsoft Project. Sort the Resources by Name and then enter the letter A for the first five Work type resources and the letter B for the next four. Leaving blank the non-Work type resources since they do not have work so there is no reason to show them in the chart.

Figure 20. Sorting in the Resource Sheet view.
Return to the report and select the chart. Change the chart to appear like the one in the screen below. Chart Design tab / Change Chart Type command.

Figure 21. Changing a chart using the Charge Chart Type command.
Next, in the Chart Data panel, Filter for Group A (enter the A group name) and then Sort By / Custom Sort / Name / Descending.
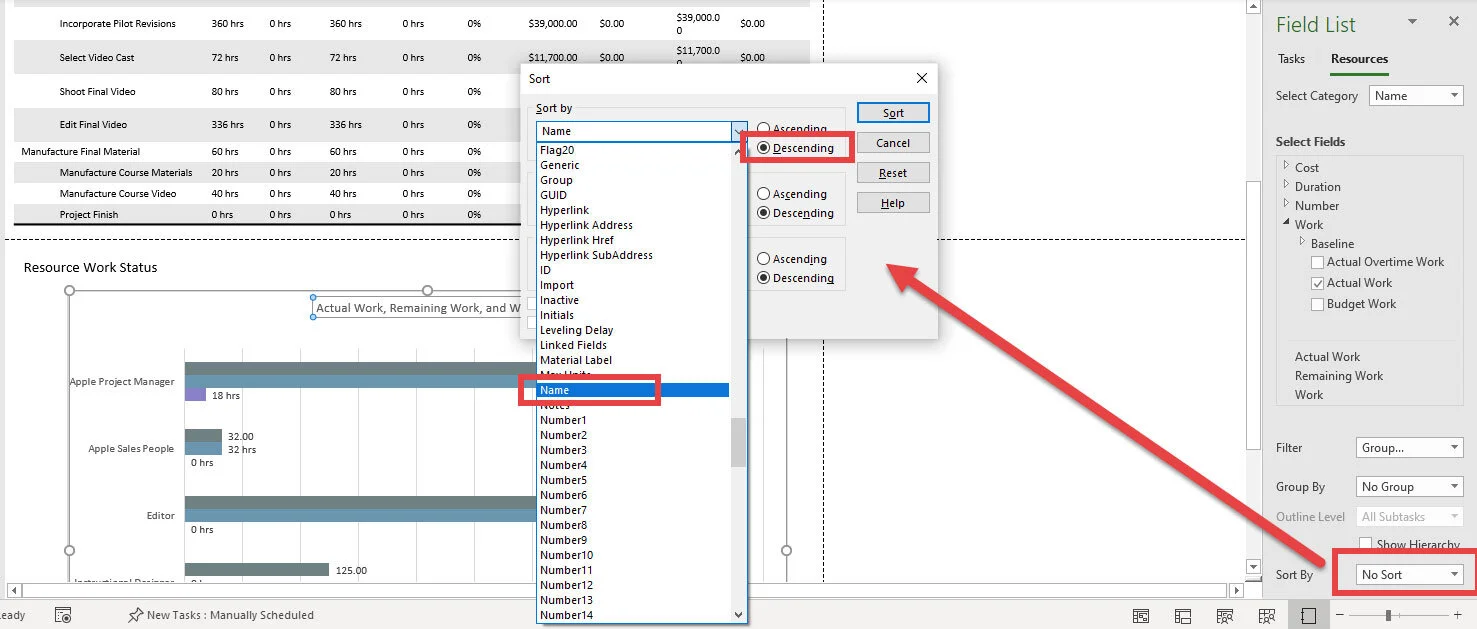
Figure 22. Filtering and then sorting data in a Standard Report chart.
Select the chart, click the plus symbol to the upper right of the chart (Chart Elements command) and check these items:
Axis
Data Labels
Data Table
Gridlines
Last, format the bar colors. Select a Work bar, NOTICE all of the other work bars are selected, right-click and fill black. Click in a way that all Work bars are selected, not just the bar for a particular resource. Format Actual Work in light gray and Remaining Work in dark gray.
Simulation Results
For the 8 - 4 Standard Reports.mpp file, the second-page chart should look like the one in the figure below.

Figure 23. Formatting a chart in Standard Reports.
Next, duplicate this chart on the next page and filter for Group B. Do this by selecting this chart and the Text Box title. Copy / Paste (keep the Source Formatting) and then drag the pasted chart and title to the next page. Remove the Group filter, apply the Group filter, select the B group, and then Sort.
Simulation Results
The chart on the third page is identical to the second-page chart except it is showing Group B resources.

Tip. When moving inserted items, zoom out, it makes it easier to click and drag items to a new page.
On the last page create a chart that charts % Work Complete for resources.
For the % Work Complete Chart on the next blank page in the report, duplicate the chart in the screen below by doing these things:
Inserting a new chart, and selecting the correct style.
Select the chart, select the Resources Field List and then Filter for Work Type resources.
Select only % Work Complete.
Format in black.
Select the Chart and then select the Task tab on the ribbon and change the font to Calibri / 10pt / black.
Select the Axis, Chart Title, Data Labels, and Gridlines elements.
Be sure to add a text title.
Save the project.
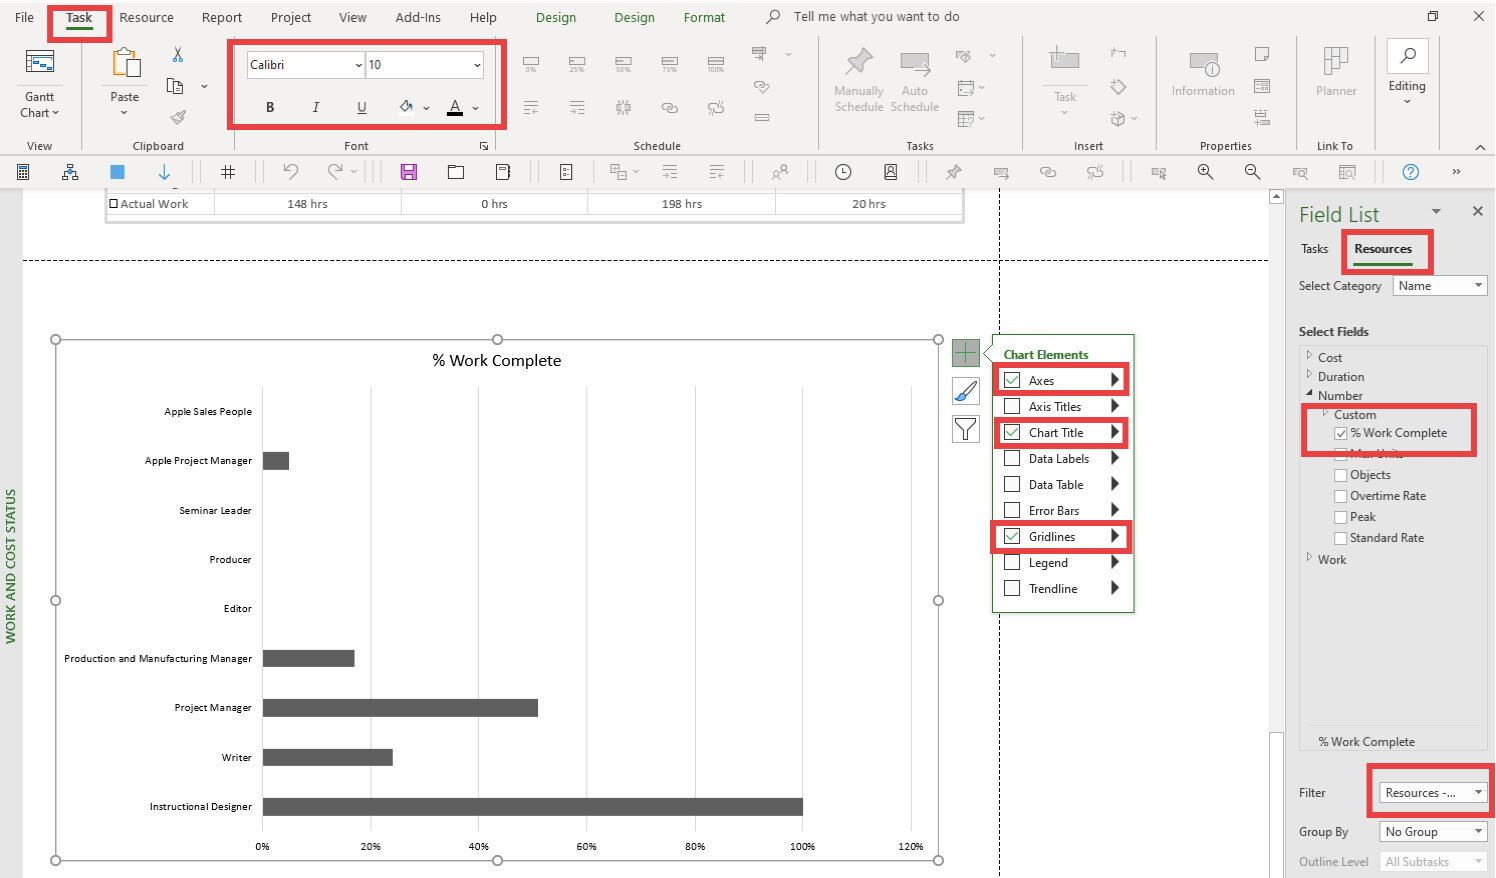
Figure 24. Formatting a resource-based chart in Standard Reports.
Simulation Results
For the 8 - 4 Standard Reports.mpp file, you should have:
Two tables on the first page, each table should appear like those in Figure 19.
A chart appears on the second page and shows work information for Group A resources and should appear like those in Figure 23.
The same chart appears on the third page, but it shows work information for Group B resources.
The % Work Complete chart on the fourth page, shows all resources as shown in Figure 24.
All colors schemes should be a close match.
Reports can be copied or printed.
Print Preview (File / Print), select the Micorosft Print to PDF driver or your choice of PDF print driver. Then do the following to complete this report:
My report is printing 8 pages and I can not figure out why. To solve the problem, I select pages 1 - 4. Also, I reduced the size of the report to 97% and it seemed to position the tables and the charts better on the pages.
Don’t show a Border around Every Page.
Add a Page Number, Project Title, Date, and your name to the Center of the Footer.
Notice in the Page Setup View tab there isn’t a way to not print blank pages, so your tables and charts will have to be rearranged if blank pages are showing in print preview. Remove the blank pages by moving around the charts.
Print your project and give it the file name 8 - 5 Standard Reports.pdf, and then Save your project.

Figure 25. Print preview of a Traditional Report.
Simulation Final
Your printed PDF should look like the one in the following figure.
The report should be on four pages.
Each chart and table is neatly positioned on each page.
Each chart and table has a text title.
The correct footer information, is printed on each page.
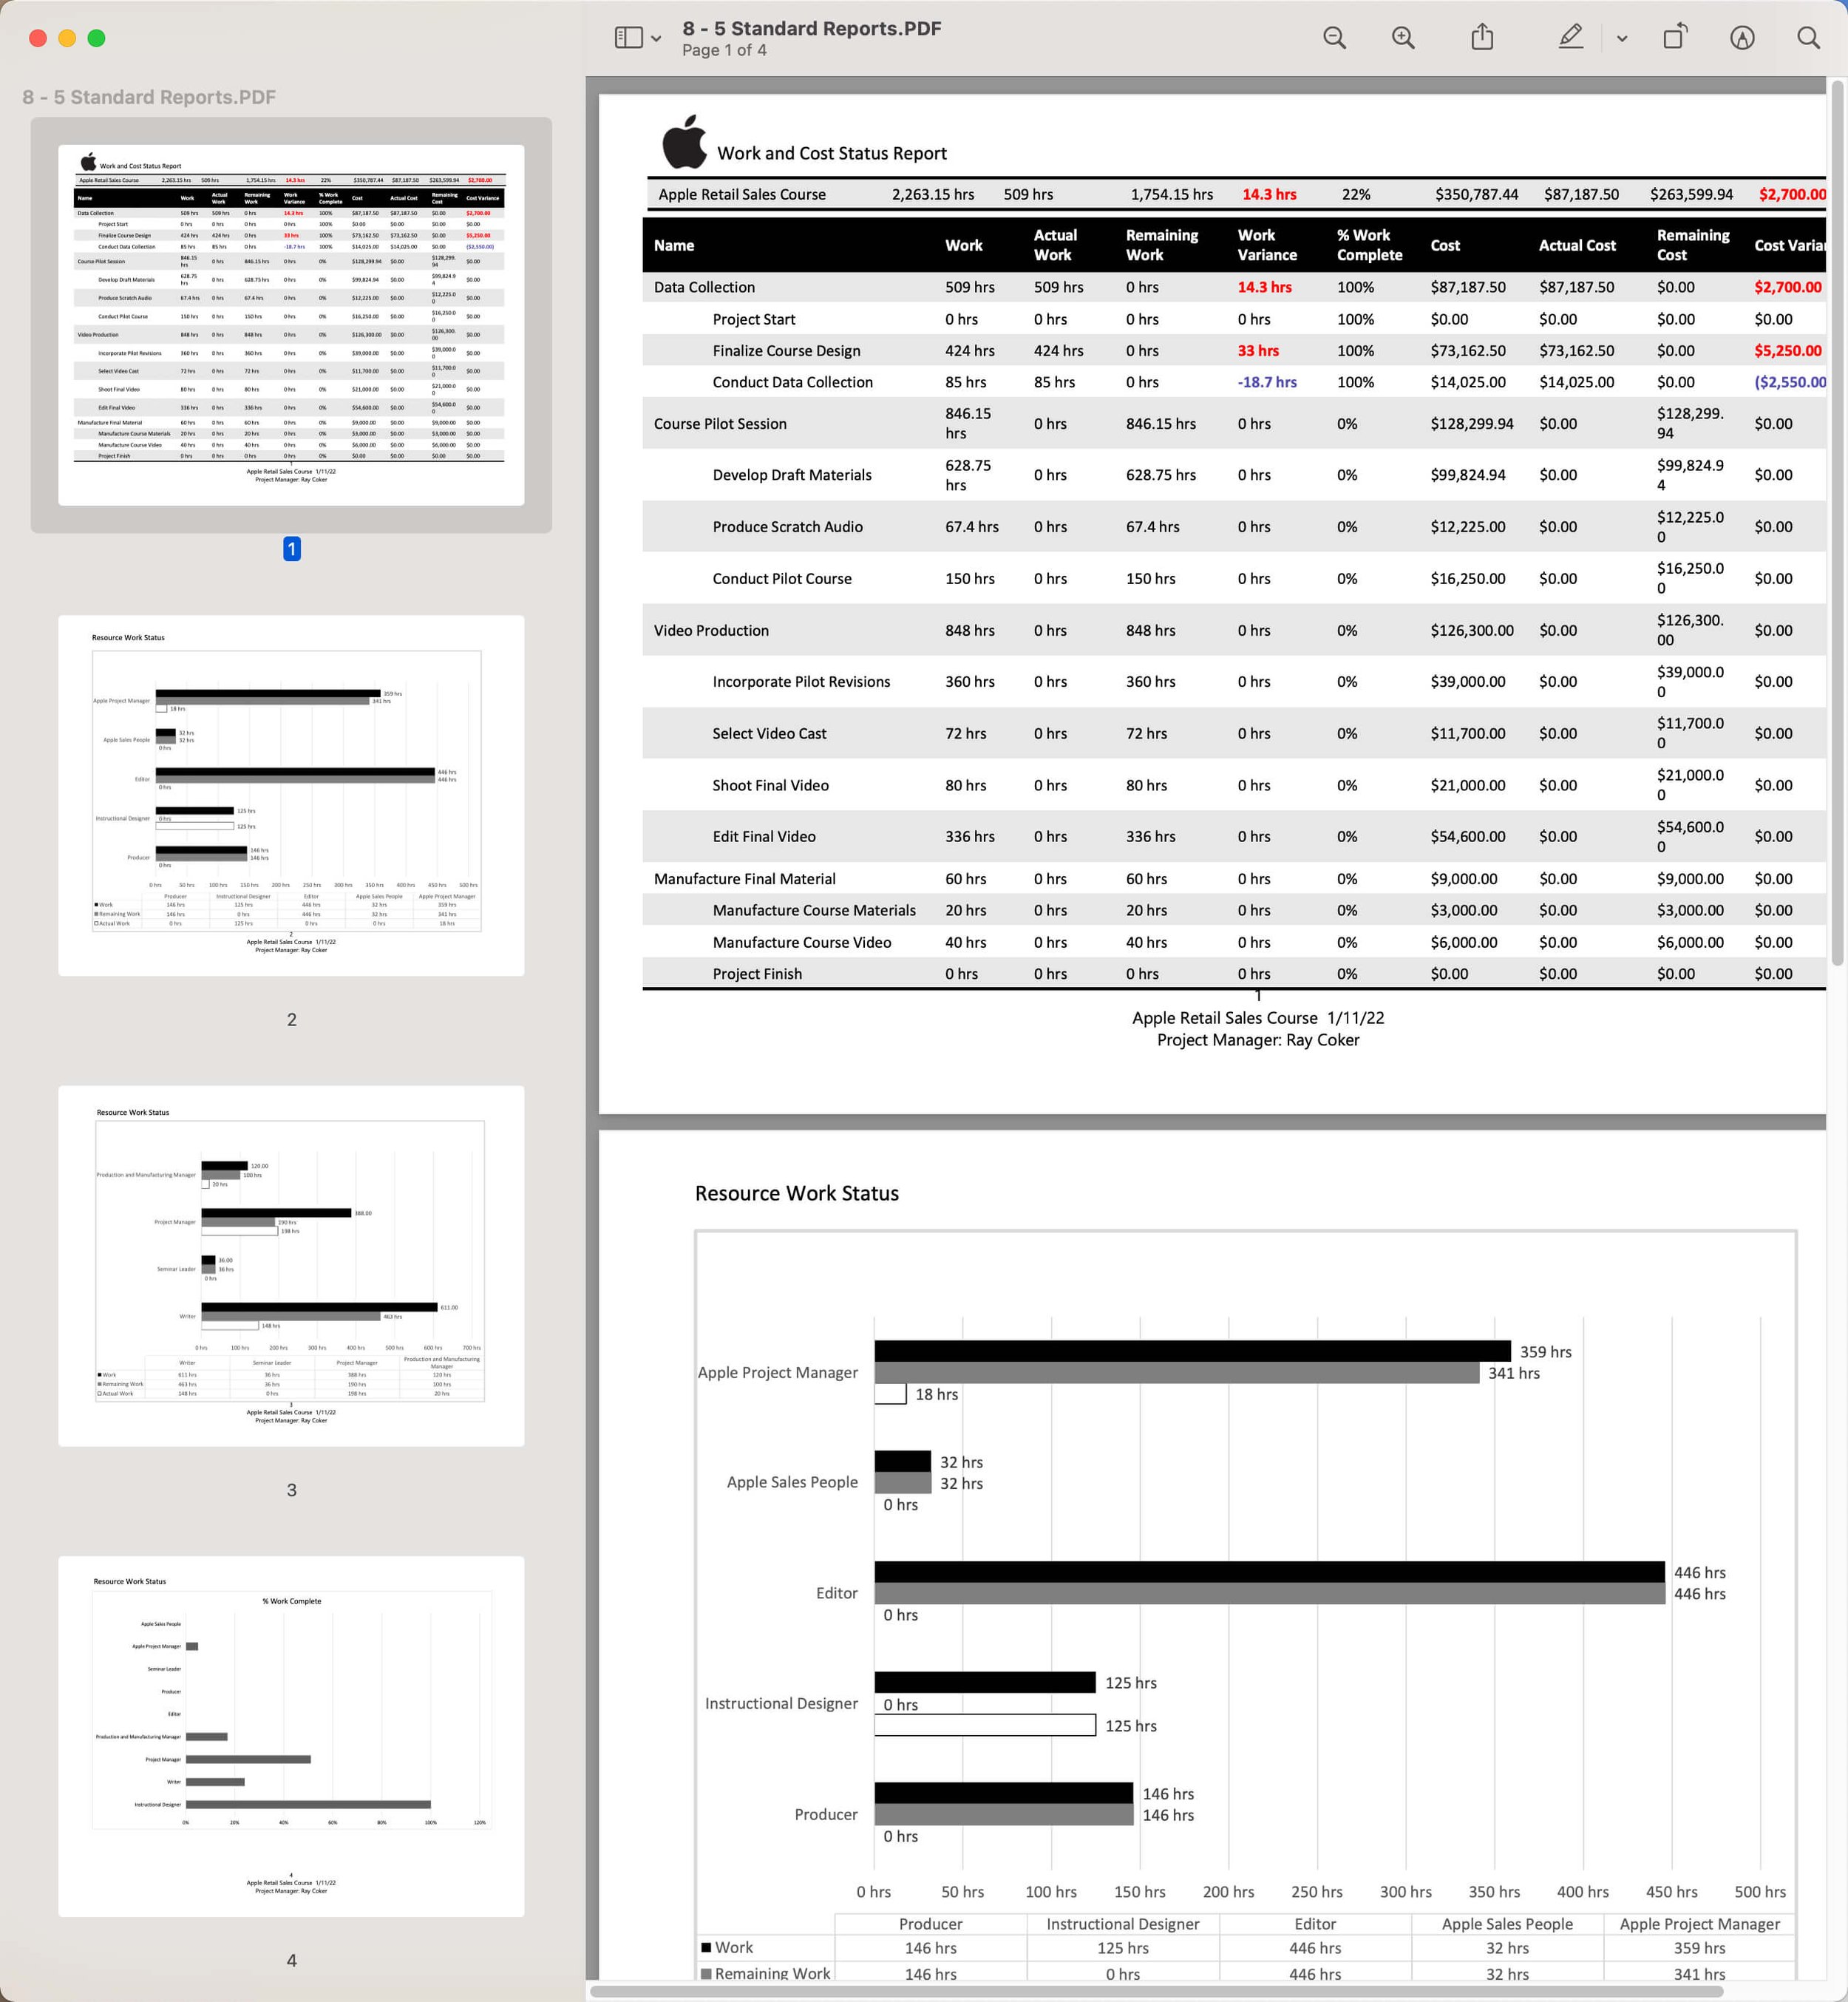
Figure 26. Printing a Standard Report as PDF.

Best Practice
Use the Organizer to manage your reports, make them available for other projects, and share them with other users.

Journal
What are the things that you should remember about views? When you think about a particular view, you should see what it looks like and how it functions. I guess you should remember that they are all either task-based or resource-based. Another thing to remember is which views can be printed. Knowing that will help you quickly decide which views will likely be used to meet some or all your reporting requirements.
Out of the 17 different types of views, 10 views are printable. Highlight those views below:
Gantt Chart view
Timeline view
Calendar view
Network Diagram view
Task Usage view.
Relationship Diagram view
Task Form view
Task Name Form view
Task Details Form view
Task Board view
Task Sheet view
Resource Name Form view
Resource Form view
Resource Sheet view
Resource Usage view
Resource Graph view
Team Planner view
2. An old comedy actor, Flip Wilson, made this saying famous, “What you see is what you get.” Even for those of us old enough to remember Flip Wilson, we knew that he claimed that what we saw was what we get, and we appreciated that attitude at the time, even though we knew that what we saw wasn’t exactly what we were going to get from Wilson. How does that saying relate to printing views?
Search Flip Wilson, “What you see is what you get.”
3. How are Project views and Standard Reports similar and different?
4. When you view a report or create a new report, how is that report treated in the Organizer?
5. There are nine tabs on the ribbon that are used with traditional reports, do you have a good handle on how they work?
6. Every table or chart in a report is either task-based or _____. ? What exactly does that mean?.
7. How would you share a report you created with another user?

If you are working with a coach, save and email them these files (8 - 2 Printing.mpp should look like Figure 13, and 8 - 3 Printing.PDF should look like Figure 16, 8 - 4 Standard Reports.mpp should look like the figures 18 - 24, and 8 - 5 Standard Reports.pdf should look like figure 26), to review. If are planning to apply to either MS Master Class certificate, archive the completed simulation files so that you can submit them for review.

Return to the Master Class Book and review the next section for this Activity.

Create Visual Reports and Copy Picture
Review
Review the Content Link and Chart 10 above on Visual Reports. (jump to)
Review Chart 10 Visual Reports in the figure below.

Figure 27. Visual Reports Chart.

Download as PDF

Visual Reports Simulation (30 minutes)

Download as *.mpp
To start this simulation, download the Visual Reports.mpp file by using the icon above and opening it in Microsoft Project. Make sure your global settings in Project Options are correct and for best results, make sure that you are using Microsoft Project 2019, 2021, or Windows 365.
Although project data can be exported to Visio, the primary purpose of Visual Reports is to export multidimensional data to Excel so that data can be manipulated for additional analysis or reporting.
The Visual Reports command is located under the Report tab.

Figure 28. Visual Reports.

Warning: Before we start, Visual Reports have had issues since Project version 2010. It works fine, then an update is applied and it doesn’t. Of the 30 or more posts I have read on this issues, in most cases, the solution is to revert back to a previous update or version or to apply a new update or version. Of all of the features and routines in Project, Visual Reports, VBA and a couple of calculation selections in Options have been the only things I have stuggled with. Project has been remarkably well behaved over the decades and I feel I have pushed it very hard at times. So, first, test to determine if Visual Reports is working for you. If you select any Excel report in Visual Reports and then click on the View button, the cube starts to build and then get this message, you will not be able to run this simulation until the issue is resolved.
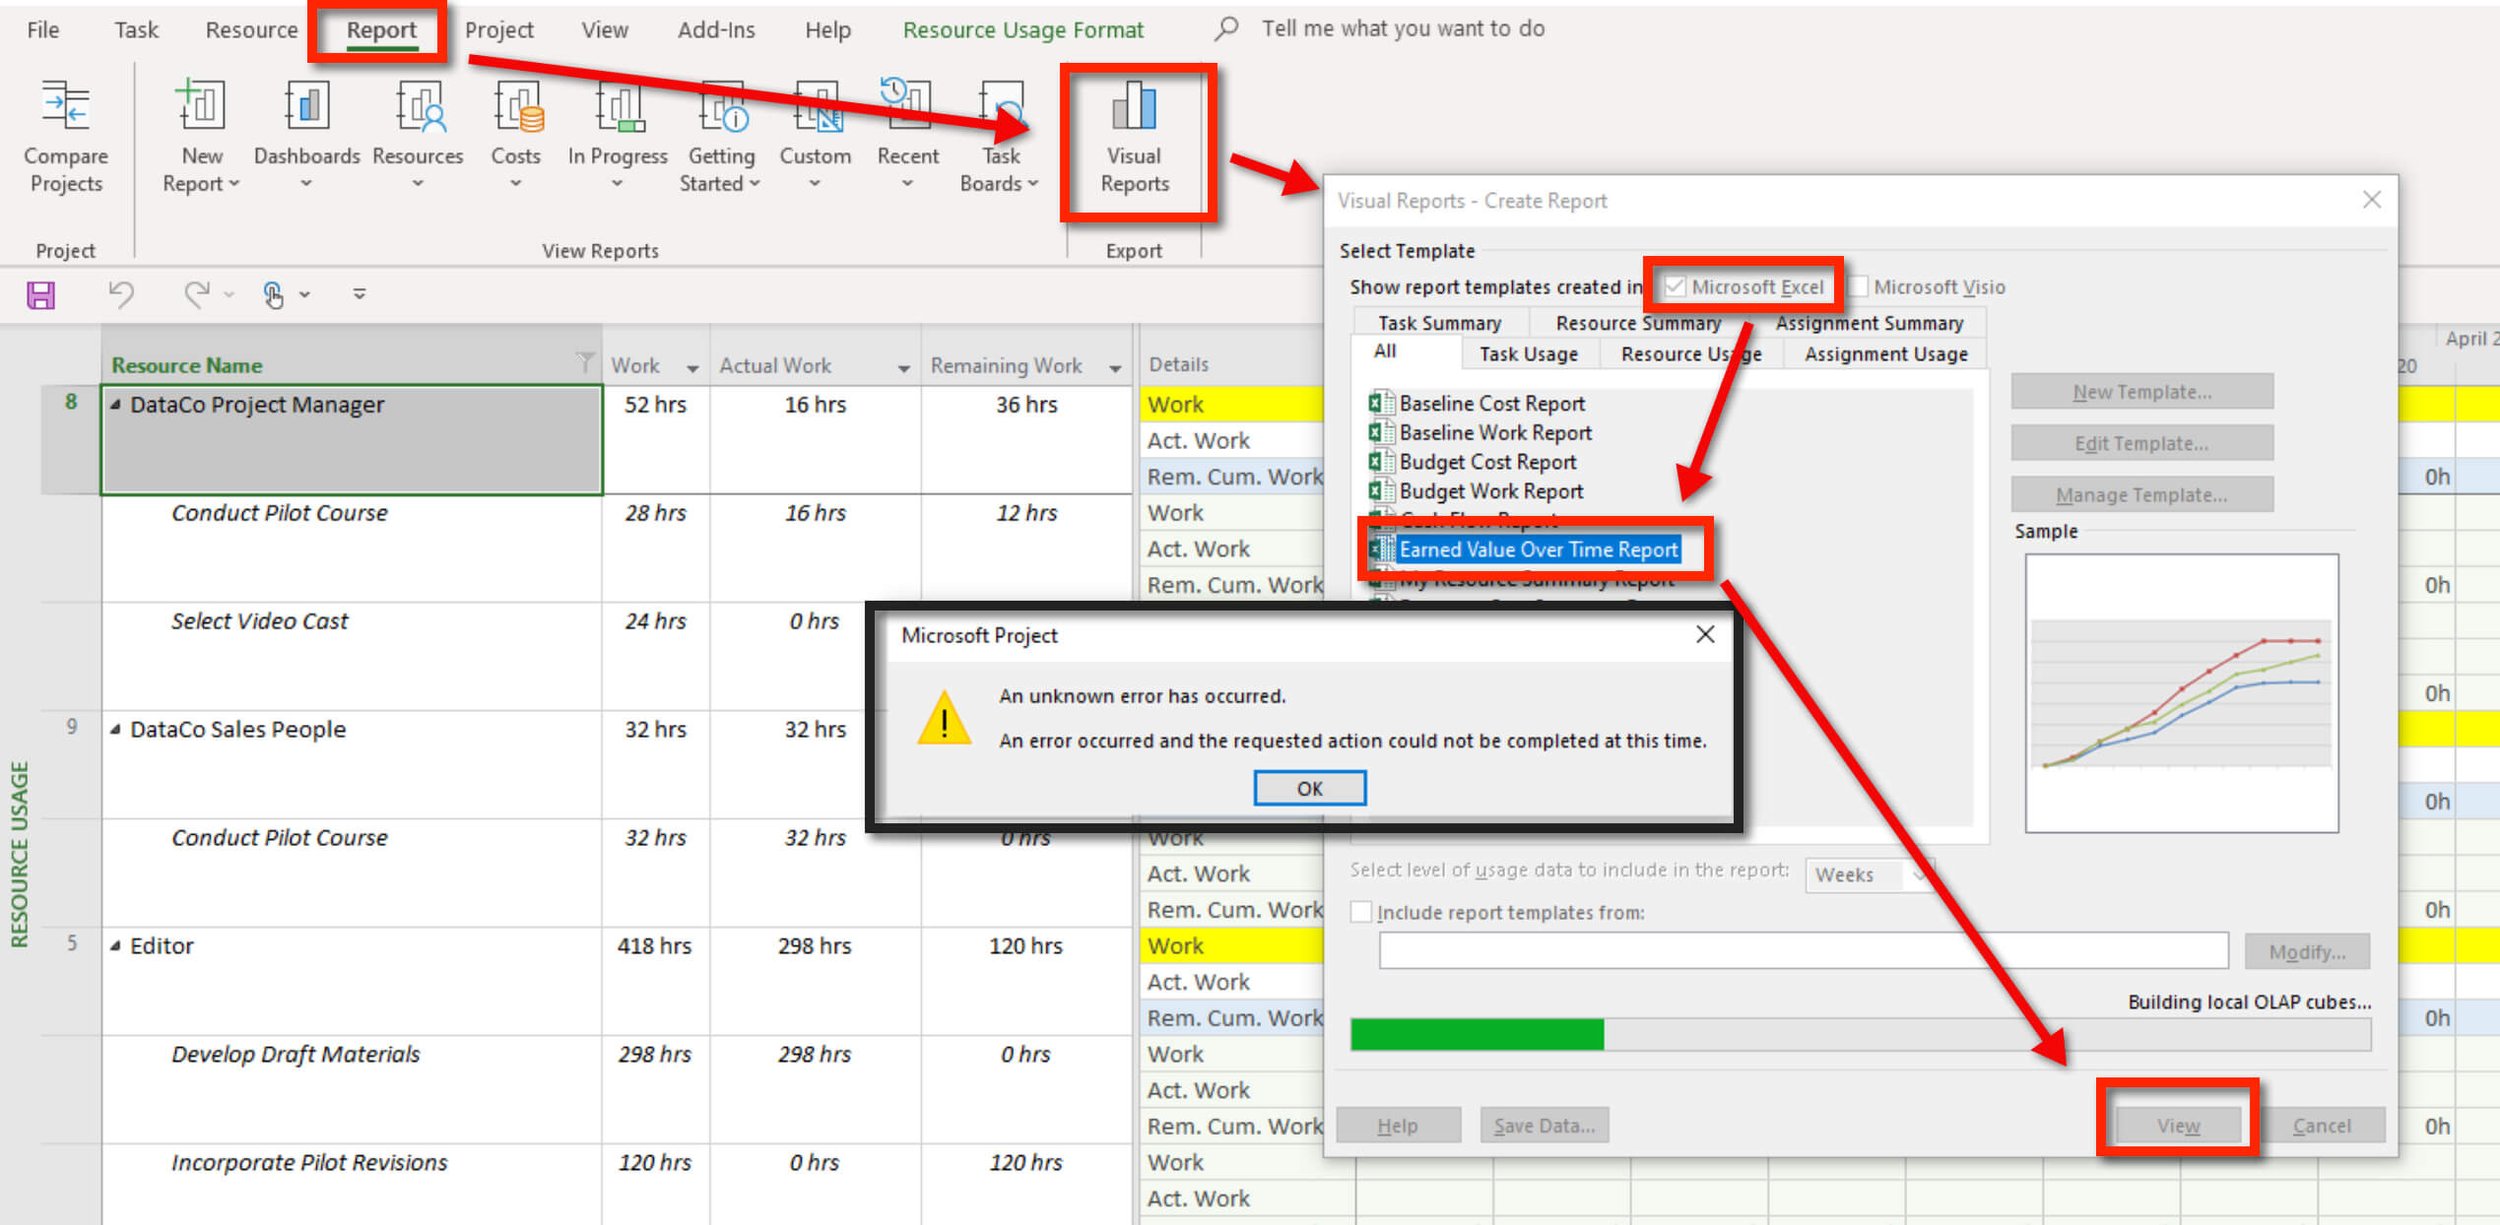
Figure 29. Visual Reports error message.
Visual Reports are export routines. These routines are saved templates, and you can create new templates and edit existing ones. In this simulation, we are going to create a new Excel template.
If you have not worked with Visual Reports, open Visual Reports, explore the functionality of the Visual Reports dialog box and run or view several of the reports.
We are going to create a new template to run a common report that is no longer available in Microsoft Project but at one time was a popular resource report. We will call this report: Who Does What When.
I think you will see the value in this report as we create this report. The report is going to show Work and Actual work for each resource cross-tabulated over time. This report is very much like a Resource Usage view that we worked with above in this Activity. The advantage of the export is to manipulate, analyze, and format the data set in Excel in ways that are not possible in Microsoft Project.
However, one weakness in the export is that Microsoft Project does not export the actual dates. The timescale will show Years, Quarters, Months, Weeks, and Days, but not the actual dates for Weeks and Days. These are the Calendar export options:
Years = Years
Quarters = Years and Quarters
Months = Years and Months (likely, the most reasonable export)
Weeks = Years, Quarters, and Weeks (Weeks are numbered and do not include dates)
Days = Years, Quarters, Weeks, and Days (Weeks and Days are numbered and do not include dates)
The one calendar option that is not available, that I would think would be the most important, is Years, Quarters, Months, and Weeks.
These calendar options will become clearer once you have run some of these reports.
Who Does What When Excel Report: Creating a New Visual Reports Template In Three Simple Steps
Step 1: Create the Type of Template
Open Visual Reports under the Report tab on the ribbon.
Select the Calendar or usage data to export. The options are Years, Quarters, Months, Weeks, and Days. A different calendar can be selected each time the report is viewed or run. Select Months. In the Visual Reports - Create Report dialog box, look for the selection Select level of usage data to include in the report:.
Select the New Template button.
Select the Excel radio button.
Select Resource Usage, in the dropdown menu, the category of data to export.

Note: This should be starting to jell by now. You know that there are four primary typs of records in Project. The resource usage view has to primary types of records, resource records and assignment records with both types crosstablulated or Timephased. You are going to create an Excel report that is going to list all of the resources and show when they are working in time.
Select the Field Picker button and select the fields you want to export. The fewer fields, the faster the multidimensional build and export. For this report, we only need three fields, Work, Actual Work, and Type. Since this is a Work report, we want to be able to filter out non-work resources so we will do that with the Type field. Click the Remove All button and then Add the three fields. If you already show a lot of fields, it is easiest to just Remove All and then add the three fields.
When finished click Ok and then Ok. The report is then built and opened in Excel.

Figure 30. Creating a new Visual Report.
Step 2: Setup the PivotTable in Excel
Using the figure below as an example:
A - Check all fields exported.
B - Move the resource Type field to the Filters box.
C - Apply the Type filter and select Work, to show just that type of resource.
D - Unselect resources, such as Unassigned.

Figure 31. Setting up the Pivot Table in Excel.
Step 3: Format Pivot Table
For example:
Remove decimals for Work, Actual Work, and totals by selecting a field and then selecting the PivotTable Analyze tab / Field Setting command in the Active Field group / Number Format.
Select a style under the Design tab.
Make selections you find interesting in the Layout group under the Design tab.
Apply a Theme under the Page Layout tab.
Format cells and add calculations if desired. Be sure not to disrupt the PivotTable in the template or restrict the movement of the PivotTable to the right or the bottom like the Remaining Work calculations in the screen below.

Figure 32. Formatting the Pivot Table in Excel.
Step 4: Save Template
Save as an Excel Template. The default location typically is: C:\Users\YourUserName\AppData\Roaming\Microsoft\Templates.
Note: In some cases, the user's settings may default to hide the AppData folder, so they may not be able to easily find this template after it's saved in that location. Follow these steps to "unhide" it:
Navigate to C:\Users\YourUserName
Click the "View" tab at the top of the file network window
Check the box next to "Hidden Items"
The AppData folder should appear in the list now
Name the Template “What Does What When.”
When prompted, select Yes to have Excel clear the data and automatically refresh the data when the template is opened.
Exit Excel and then Close Visual Reports in Microsoft Project and open again. You should see the Excel Template you just saved.

Figure 33. Message to clear data and automatically refresh when the template is used.

Figure 34. New templates will show in the All tab.
If you do not see the template you just created, click on the Modify button and select the location of the template file. You can test this template by opening another project with resource assignments and by running the Who Does What When Visual Report.
Simulation Results
Take a screen capture of the Excel template file. (Press Ctrl + PrtScn keys or use a capture app.) Name the file 8 - 6 Visual Reports.jpg. Use any common extension like tiff or png.


Download *.mpp & *.pptx files
To start this simulation, download the Copy Picture.mpp file using the icon above and open it in Microsoft Project. Make sure your global settings in Project Options are correct and for best results use Microsoft Project 2019, 2021, or Windows 365.
Also, download the Status Presentation.pptx file and open it in PowerPoint. Rename this file to 8 - 7 Status Presentation.pptx. Enter your name as the author of this document.
In this last section on reporting, we are going to look at the different options related to Copy, Copy Picture, and the various Paste options.
In many types of reporting, both formal and informal, you will want to take a snapshot of some aspect of your project and paste it within an email, PowerPoint slide, or some other type of document.
These various Copy, Copy Picture, and Paste features work better or worse depending on what you are trying to accomplish. Being familiar with the options will help you quickly decide what is likely to work best.
In this simulation, you are going to Copy a Timeline view, a Gantt Chart View, and a Standard Report into three different slides of the PowerPoint file you downloaded.
Timeline View Copy
Apply the Timeline view. In this view, the remaining Phases of the project are included on the Timeline. The last two Phases are in Callout and highlighted in red. Let’s say you would like to be able to show the status data on the timeline, so a workaround is to open Project Information on the Project tab and type in the Status Date in the Current Date field. The Today field shows the information from the system clock, but you can temporality enter any date that you want.
The Copy Timeline is the capture feature for this type of view. There are three optimized types of capture shown in the figure below. A safe assumption is that the For Presentation is the best selection to try first since you are going to be pasting to PowerPoint. However, it is not always the case that the logical selection, depending on a lot of variables, is the best capture selection. You might try all three to determine what works best.
Click the Format tab and then select the Copy Picture command and make a selection.

Figure 35. Copy Picture command in the Timeline view.
When using Paste, there are three options to select: Use Destination Theme, Keep Source Formatting, and Picture.
Paste this Timeline into slide three of the PowerPoint deck. You might try several approaches to get the best results.
On my device, with my operating system and my versions of the software, I found that the best result for this presentation was: Copy / Full Size and Paste / Picture.

Figure 36. Paste Options when pasting a Copy Picture of aTimeline view.
Copy Picture a View
Apply the Gantt Chart view. We are going to copy this view and paste it into PowerPoint, but first, let’s set something up.
Apply the Incomplete filter, to only show tasks that are not 100% complete.
Adjust the pane divider between the table and the taskbars to make sure all five columns are showing.
The Status date is shown as a red vertical line in the taskbar area of the window. Move that line close to the pane divider and zoom the project to fill the available space in the window.
We are not going to do this, but you can just copy and paste the tasks. This is a good option when you just want to paste a table of data, as shown in the figure below. There are four different types of paste you can select from when the target is a slide in PowerPoint.

Figure 37. Selecting and pasting tasks.
When you want to show tasks bars, Copy Picture is the best capture option. This command is found under the Task tab in the Clipboard group.
Select all of the tasks in the Gantt Chart view, and then click Copy Picture and make the same selections shown below in the Copy Picture dialog box.

Figure 38. Copy Picture command in a view.
When pasting into PowerPoint, there are two selections. Paste this picture into slide number four.

Figure 39. Copy Picture a view pasted into PowerPoint.
Standard Report Copy
The last copy we are going to do is the Copy Report command for Standard Reports. Open the Critical Task report under the Report tab and the Recent command.
Like some of the other views in Project, you can copy the table or use the Copy Report command. In this case, the difference is in what is actually copied. The Copy Report command will copy all elements (Charts, Tables, Images, etc.) in the report, while copy only copies what is selected in the report.
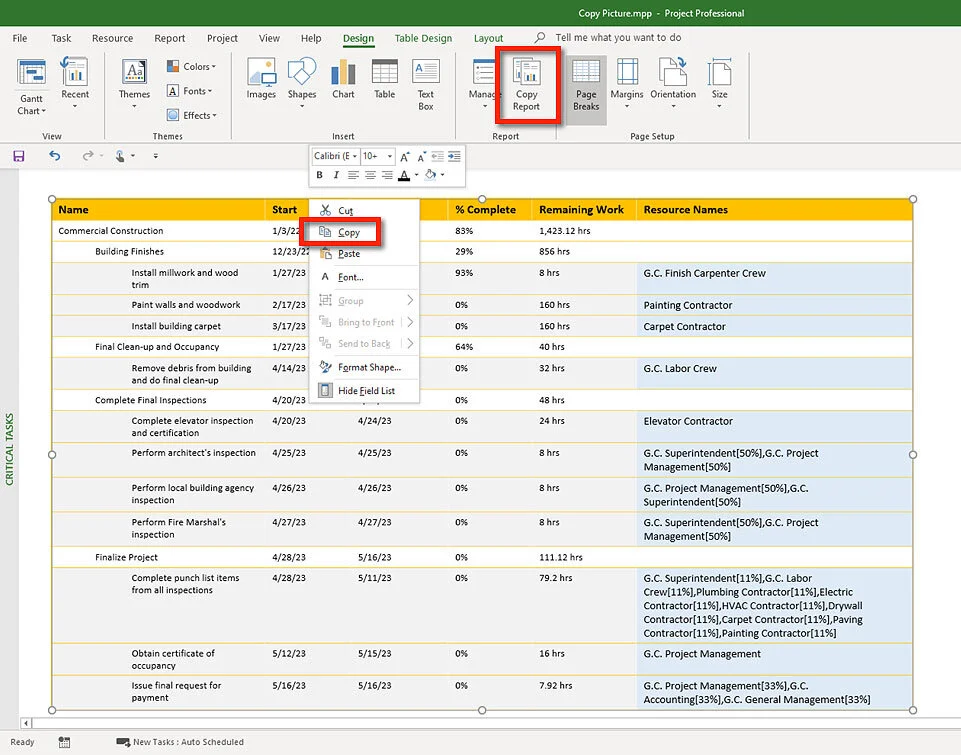
Figure 40. Copy Picture of a Standard Report.
Copy the report and then paste into slide five. There are two Paste options. When you have completed this last paste, the presentation is complete.
Save your presentation.
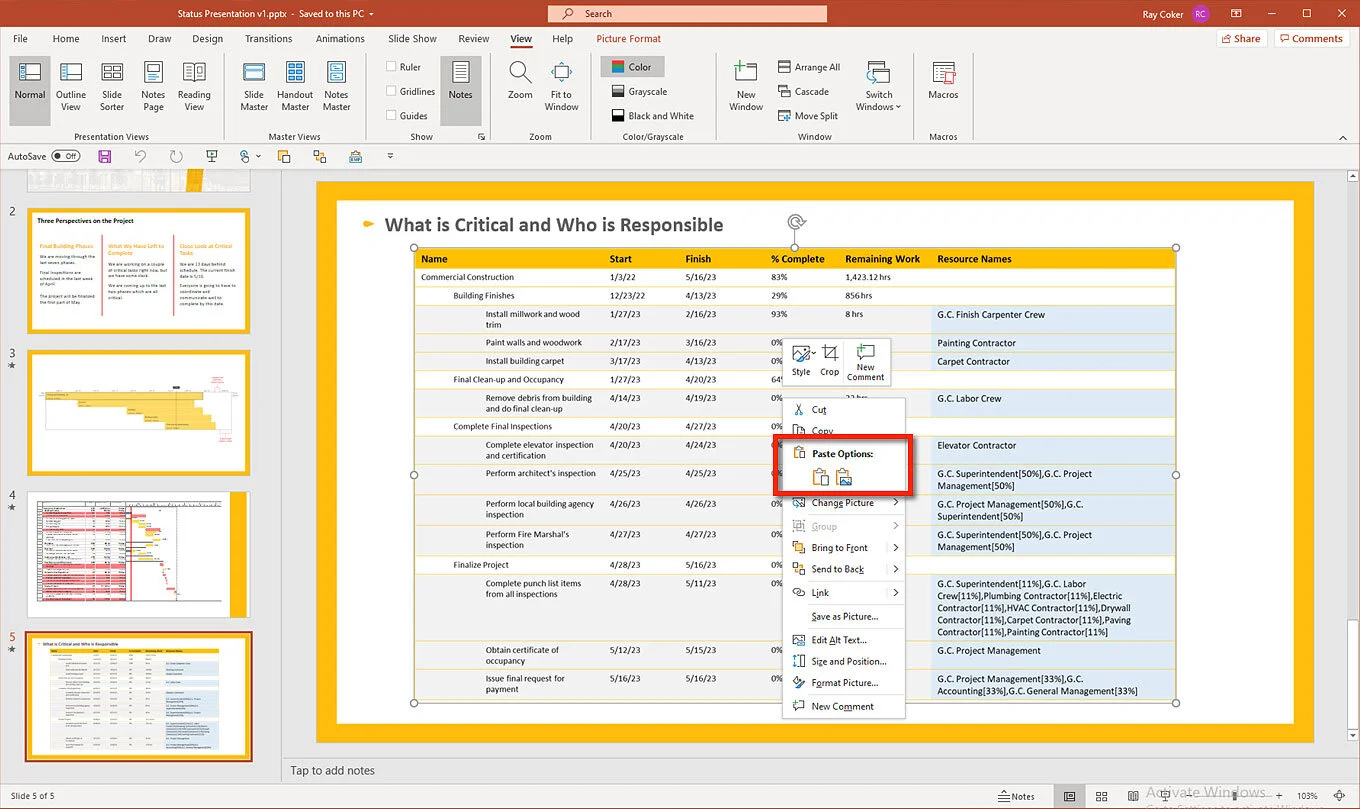
Figure 41. Copy Picture command of a Standard Report pasted into PowerPoint.
Simulation Results
There are five pages in this Copy simulation. The PowerPoint file should have five pages. The last three slides should appear like those in the figures above.
Before completing this Activity, be sure to bring your MS Project Master Class Plan.mpp up to date, including entering how much time you spent on each detail task in the Timesheet column. Send this file to your coach if you have one, or archive it for a certificate if desired.
Last, create a work report for this project. The type of report you might give your manager related to the work you are doing on this Master Class. The report design can is entirely up to you. Name this report as 8 - 8 MS Project Master Class Plan. The output could be PDF or a picture in a document like PowerPoint.

Journal
What is good communication a function as argued in this Activity? As composer John Powel claims, “Communication works for those who work at it.” It takes effort to determine who needs what, when, and it takes effort to know how to get the report data out of the project and presented in the best format for a particular audience.
What is the primary purpose of Visual Reports?
What is the difference between Visual Reports and the export to Excel using a Map (import/export routine) element?
What is the process for creating a Visual Report Excel template?
Which views does Copy Picture work with?
Where is the Copy Picture command found?
There are two other Copy Picture related commands in Microsoft Project; what are they?

If you are working with a coach, save and email them these files (8 - 6 Visual Reports.jpg which is the screen capture of the Excel exported file, 8 - 7 Status Presentation.pptx in which each page looks like those in figures 36 - 41, and 8 - 8 MS Project Master Class Plan work report), to review. If are planning to apply to either MS Master Class certificate, archive these completed simulation files so that you can submit them for review.

Return to the Master Class Book and review the next section for this Activity.

Review of Best Practices
Plan Communications Workflow
Group stakeholders, rank, and plan communications.
For each communication, list receivers, senders, information, schedule, and format.
Conduct a dry run to confirm that all stakeholders get the reporting they want and when they want it.
Standard Reports
Use the Organizer to manage reports.
Printing Views
If a view is going to be printed during each update cycle, create a new view just for printing so that it does not need to be re-formatted for each WYSIWYG print.
For Views that you print out routinely, create a custom view with all of the other custom elements associated with the view such as tables and filters, and use those elements for just reporting. Consider naming the custom elements the same name as the report.
Page Setup for printing is saved with the view, so sharing views with other projects or users, also shares that setup.

Activity 8 Exam
Complete this Activity by taking this exam. Take the exam here.
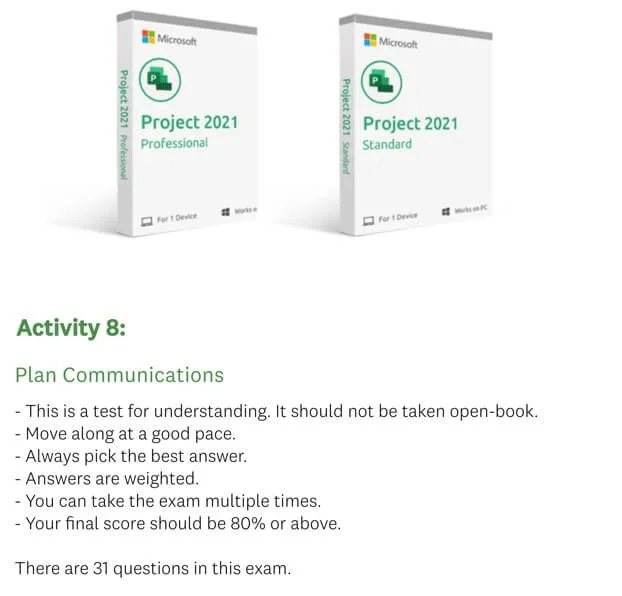
Figure 42. Activity 8 Exam.
Simulation Files
MS Project Master Class Plan.mpp (Through this Activity, this project should include all of the activities, estimates of duration, you should be assigned at the appropriate amount of work, all of the activities are linked together with standard dependencies and should be scheduled appropriately. You should have a Must Finish on finish date for the last task and you should have a record of the time you have spent on each activity to date.)
In addition, print a meaningful Work report from the MS Project Master Class Plan.mpp. This should be a PDF report titled 8 - 8 MS Project Class Plan. The type of report, appearance, formatting, data, etc., for this report, is entirely up to you.
8 - 1 Work.mpp (This file should have the appropriate notes in two different Notes fields as directed.)
8 - 2 Printing.mpp (This file should look like Figure 13.)
8 - 3 Printing.PDF (This file should look like Figure 16.)
8 - 4 Standard Reports.mpp (This file should look like the figures 18 - 25.)
8 - 5 Standard Reports.pdf (This file should look like figure 26.)
8 - 6 Visual Reports.jpg (Visual Reports export to Excel.)
8 - 7 Status Presentation.pptx (Each page looks like those in figures 36 - 41.)

Using Process Bridge? It’s easy to follow the workflow…
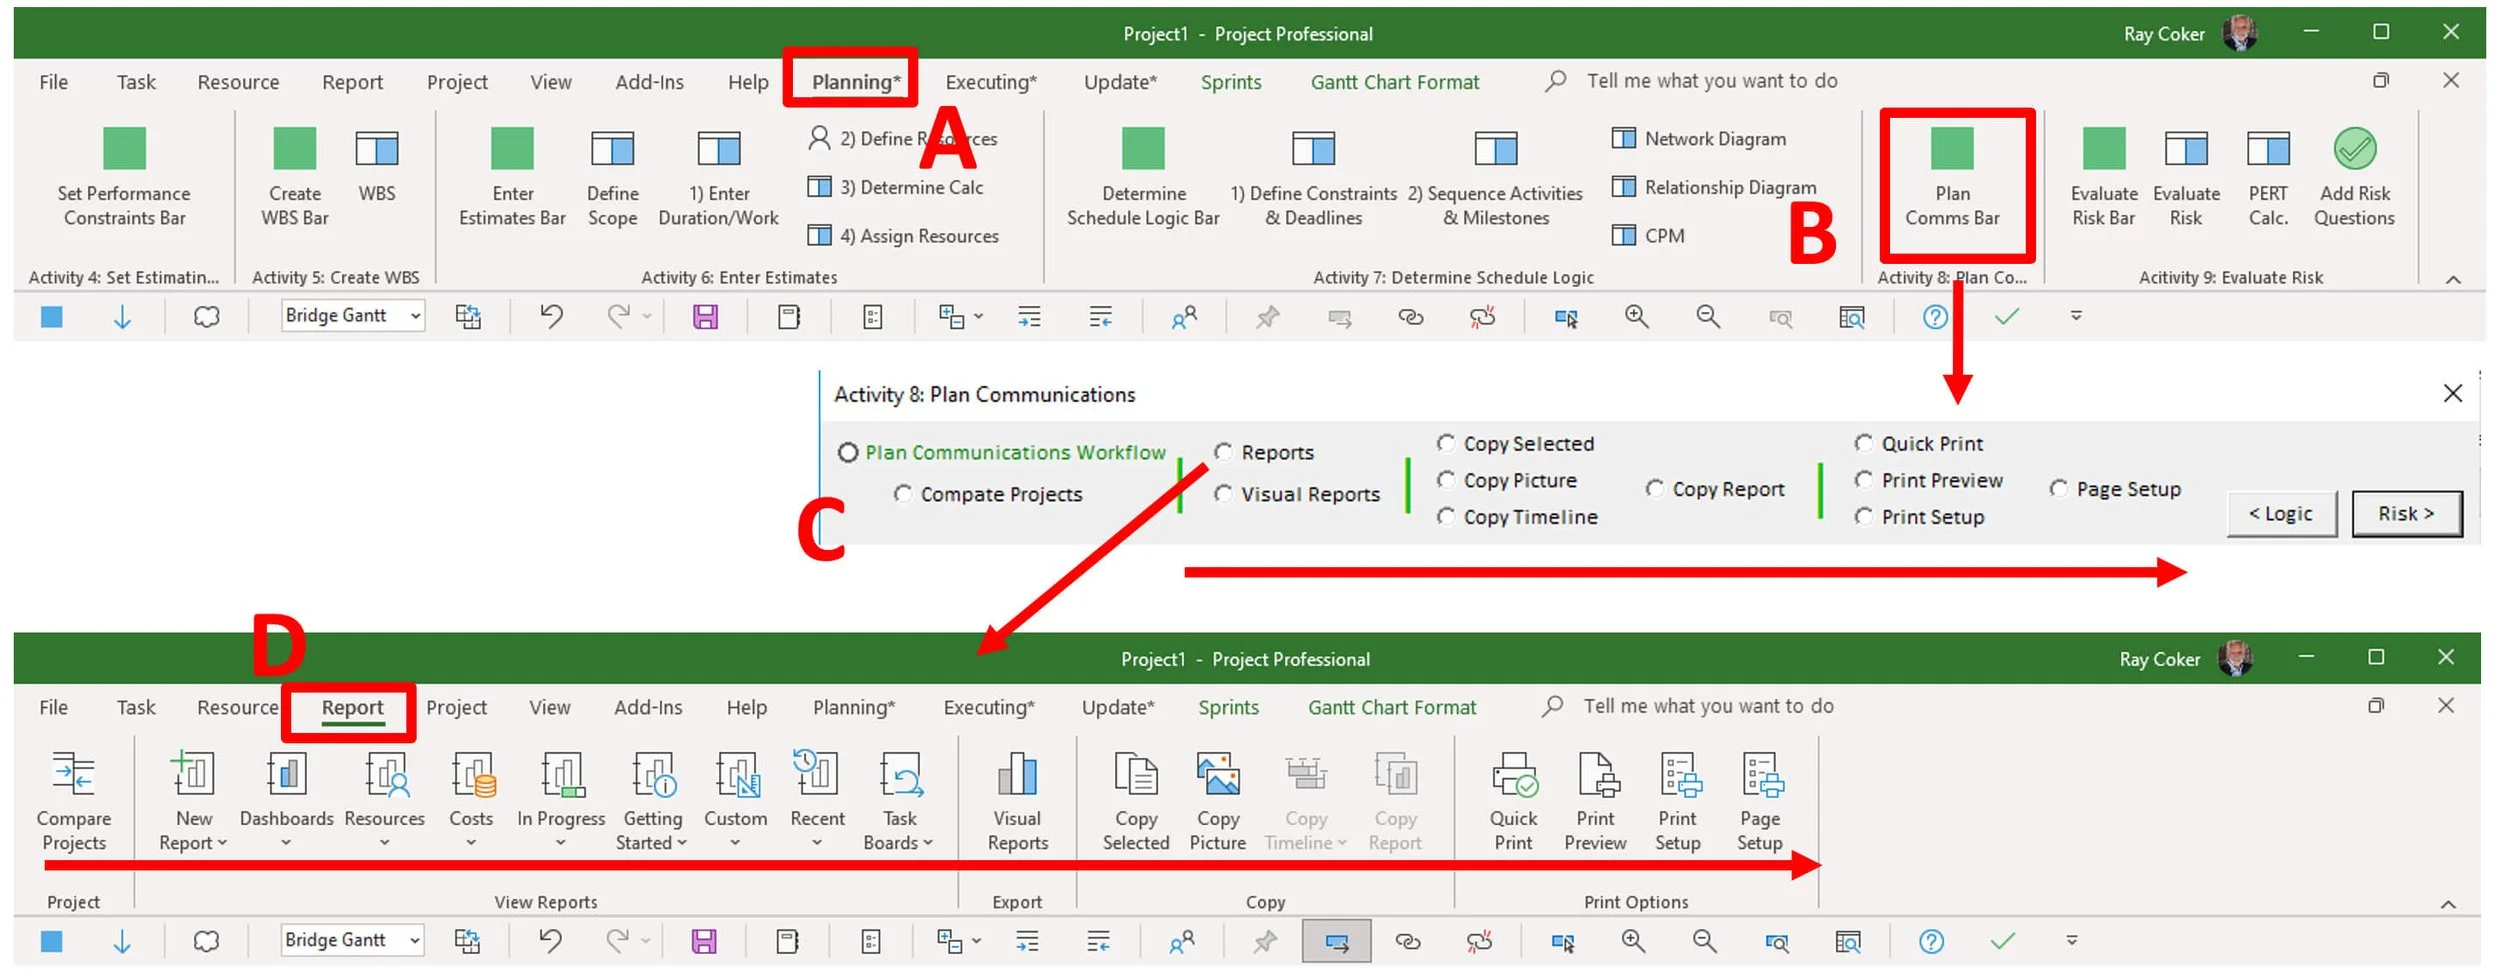
Figure 44. Activity 8: Plan Communications
A - Plan Communications is located under the Planning tab on the ribbon.
B - Plan Comms Bar command opens the Activity 8: Plan Communications floating bar.
C - The floating bar contains all of the core reporting functionality.
Plan Communications Workflow
Compare Project
Reports
Visual Reports
Copy Options
Print Options
D - The Report tab also contains all of the core reporting functionality. The Report tab comes standard with Microsoft Project. The Copy and Print Options have been added to the tab.
Compare Projects (This feature is not viewed as a reporting feature)
Reports
Visual Reports
Copy Options
Print Options
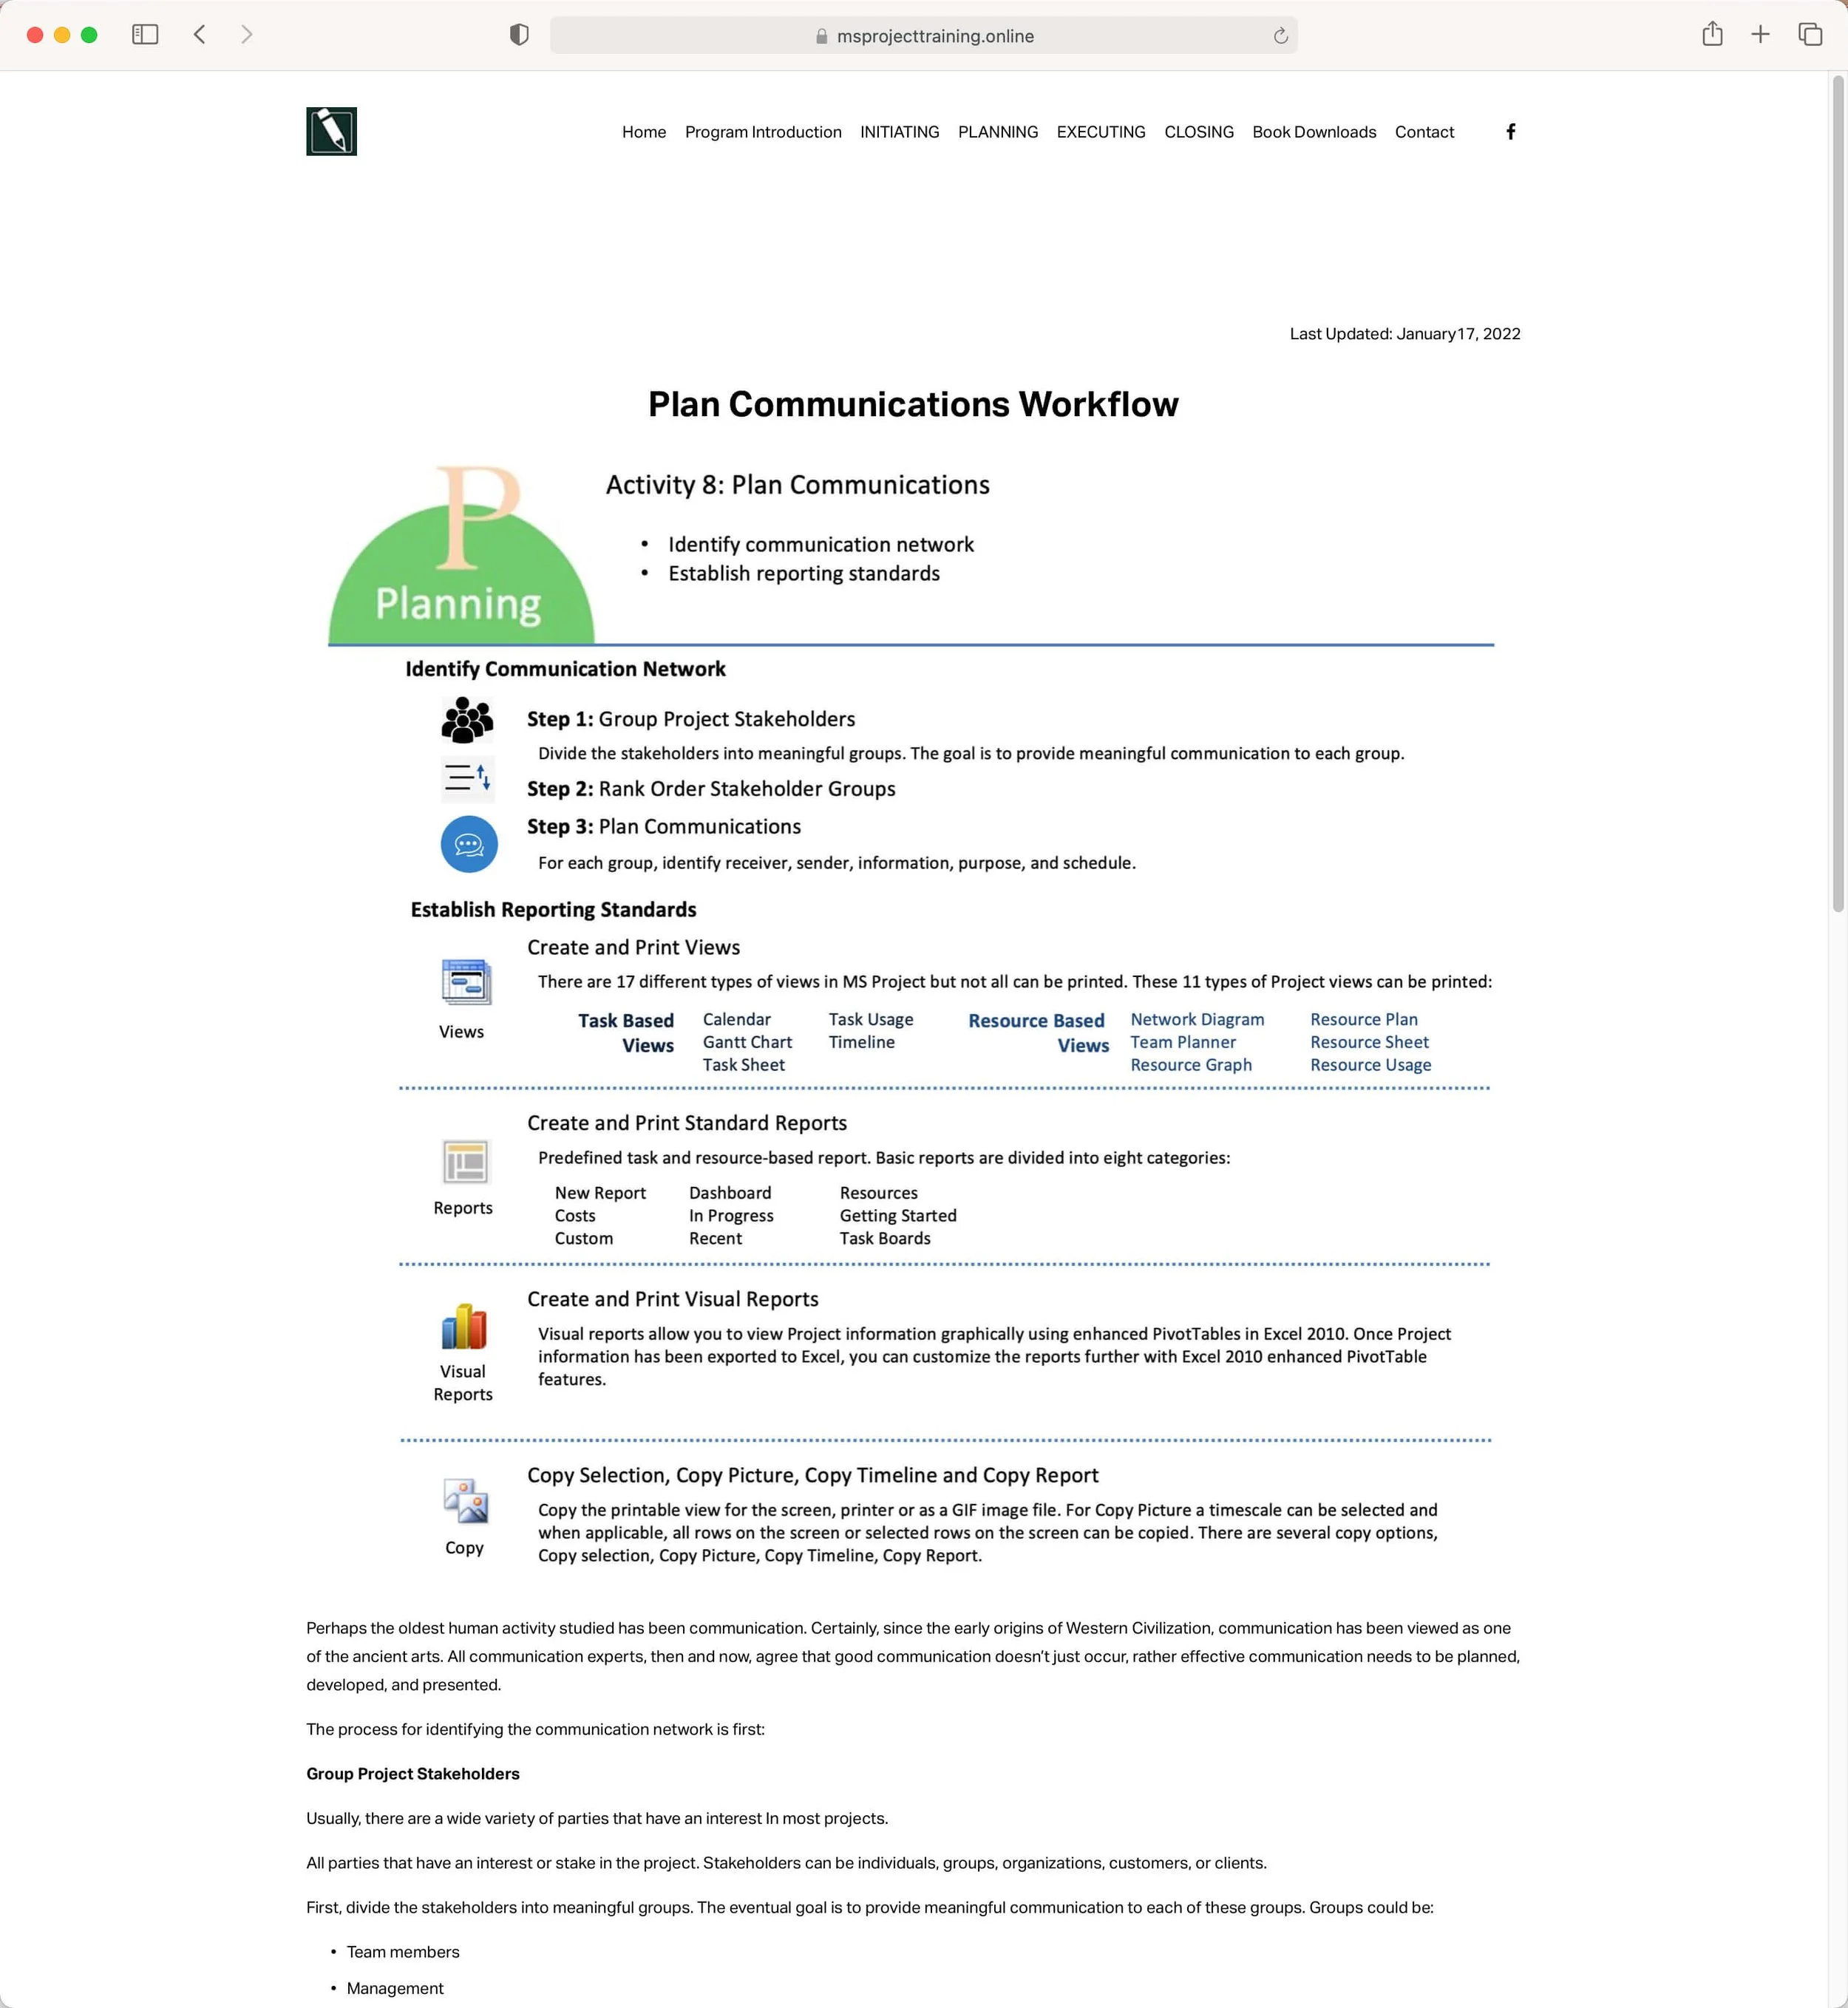
Figure 44. Plan Communications workflow.
Compare Projects is not covered in this Activity on reporting. It appears to be a misplaced command since it is more of an analytical feature rather than a reporting tool.
The Visual Reports command opens the Visual Reports - Create Report dialog box for exporting data to Excel and Visio.

Figure 45. Visual Reports.
With data selected, Copy Selected will copy the selection to be pasted into an email, or presentation document. If selecting tasks, that selection can be pasted as new tasks, or as rows and columns in a spreadsheet.
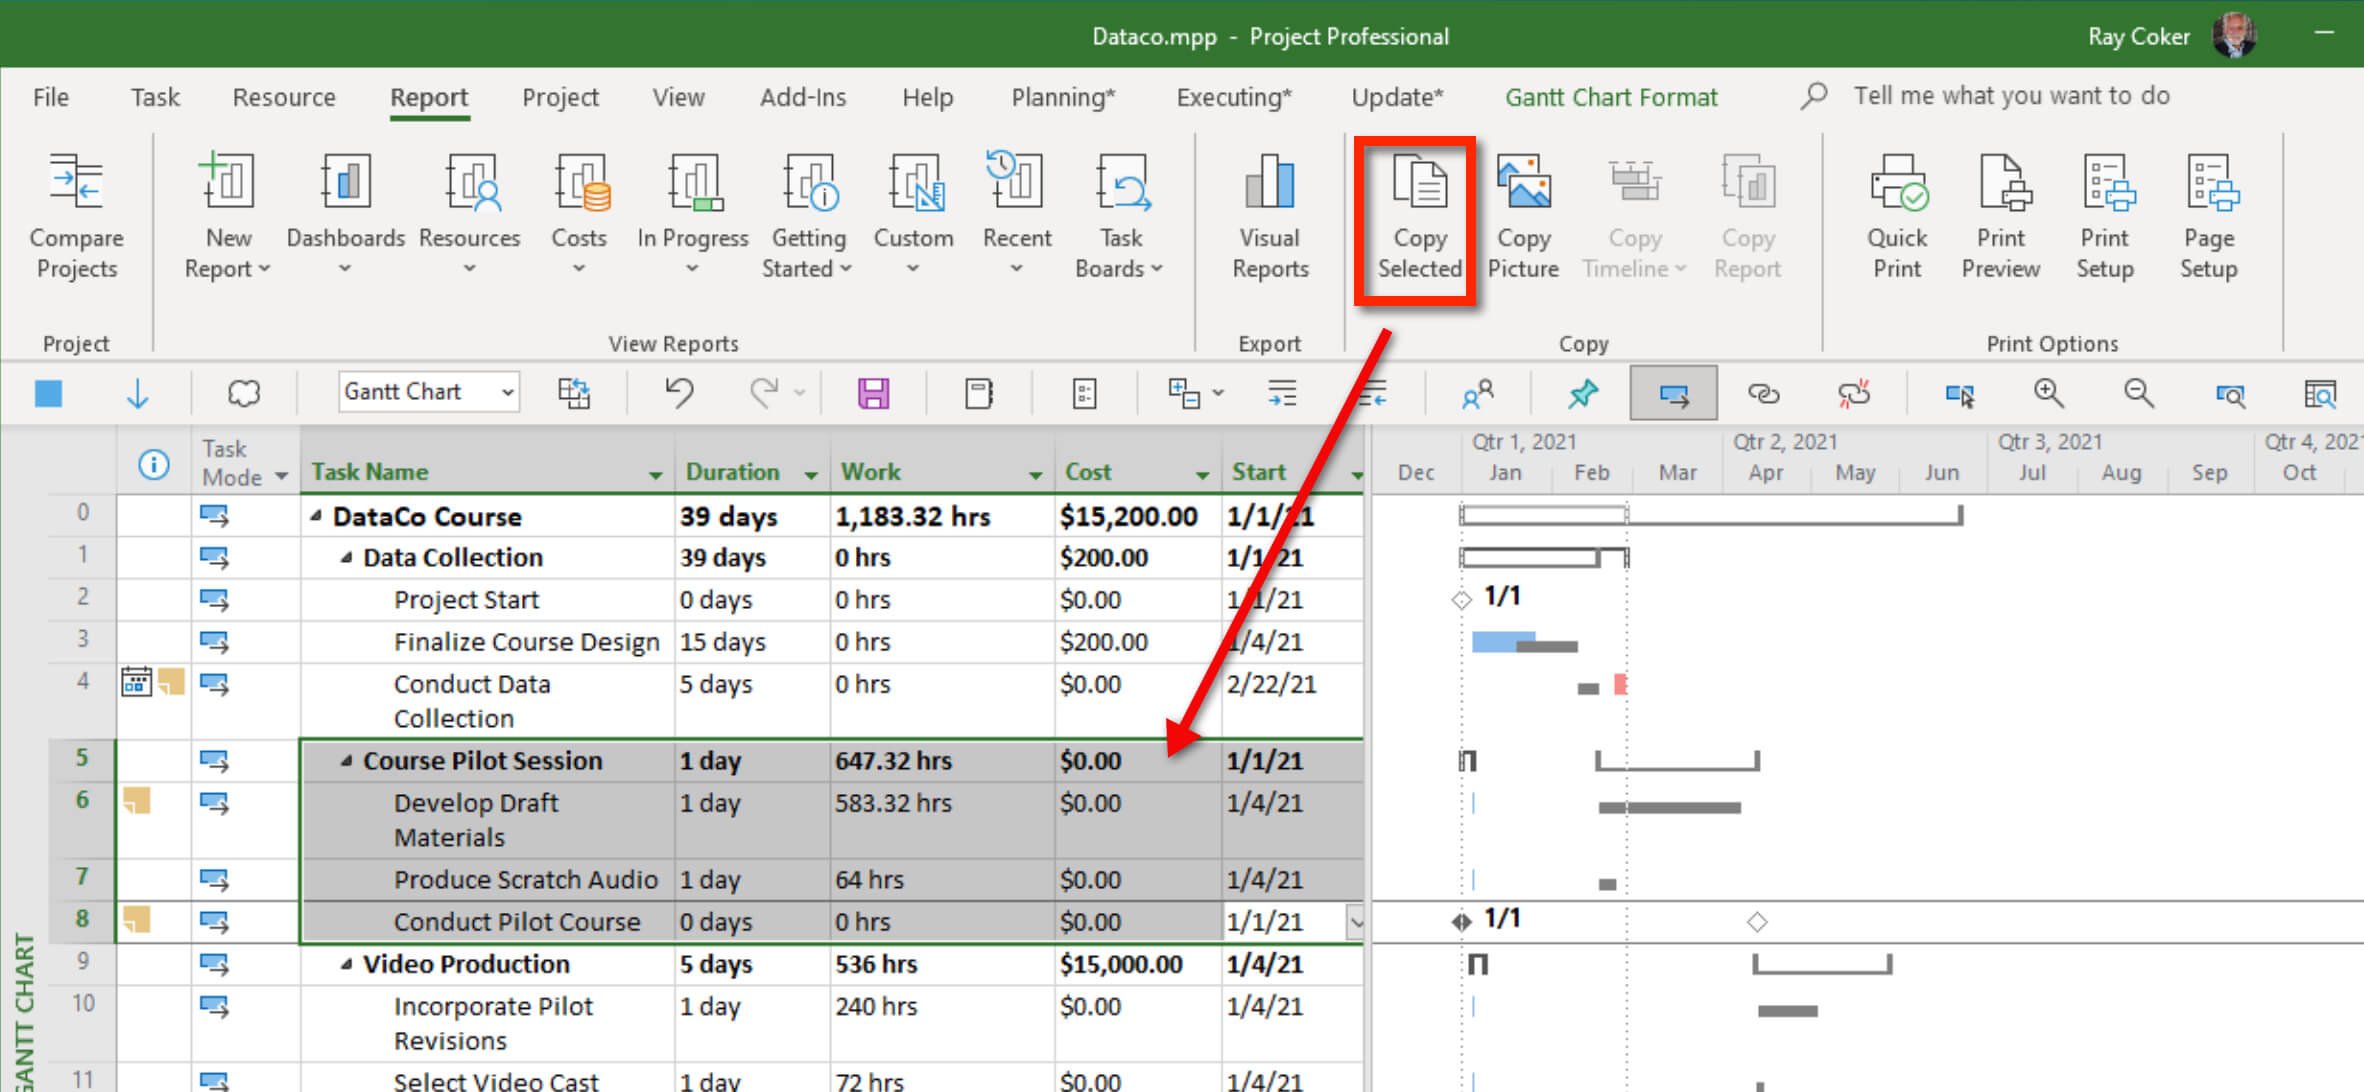
Figure 46. Copy Selected.
The Copy Picture command copies selected tasks or resources or task or resources on screen, for screen, for printer, or as a GIF.

Figure 47. Copy Picture.
The Copy Timeline command is used to copy a Timeline view. Copy Timeline from the floating bar will copy For Presentation, while the Copy Timeline from the ribbon, allows you to select For E-mail, For Presentation or Full Size.
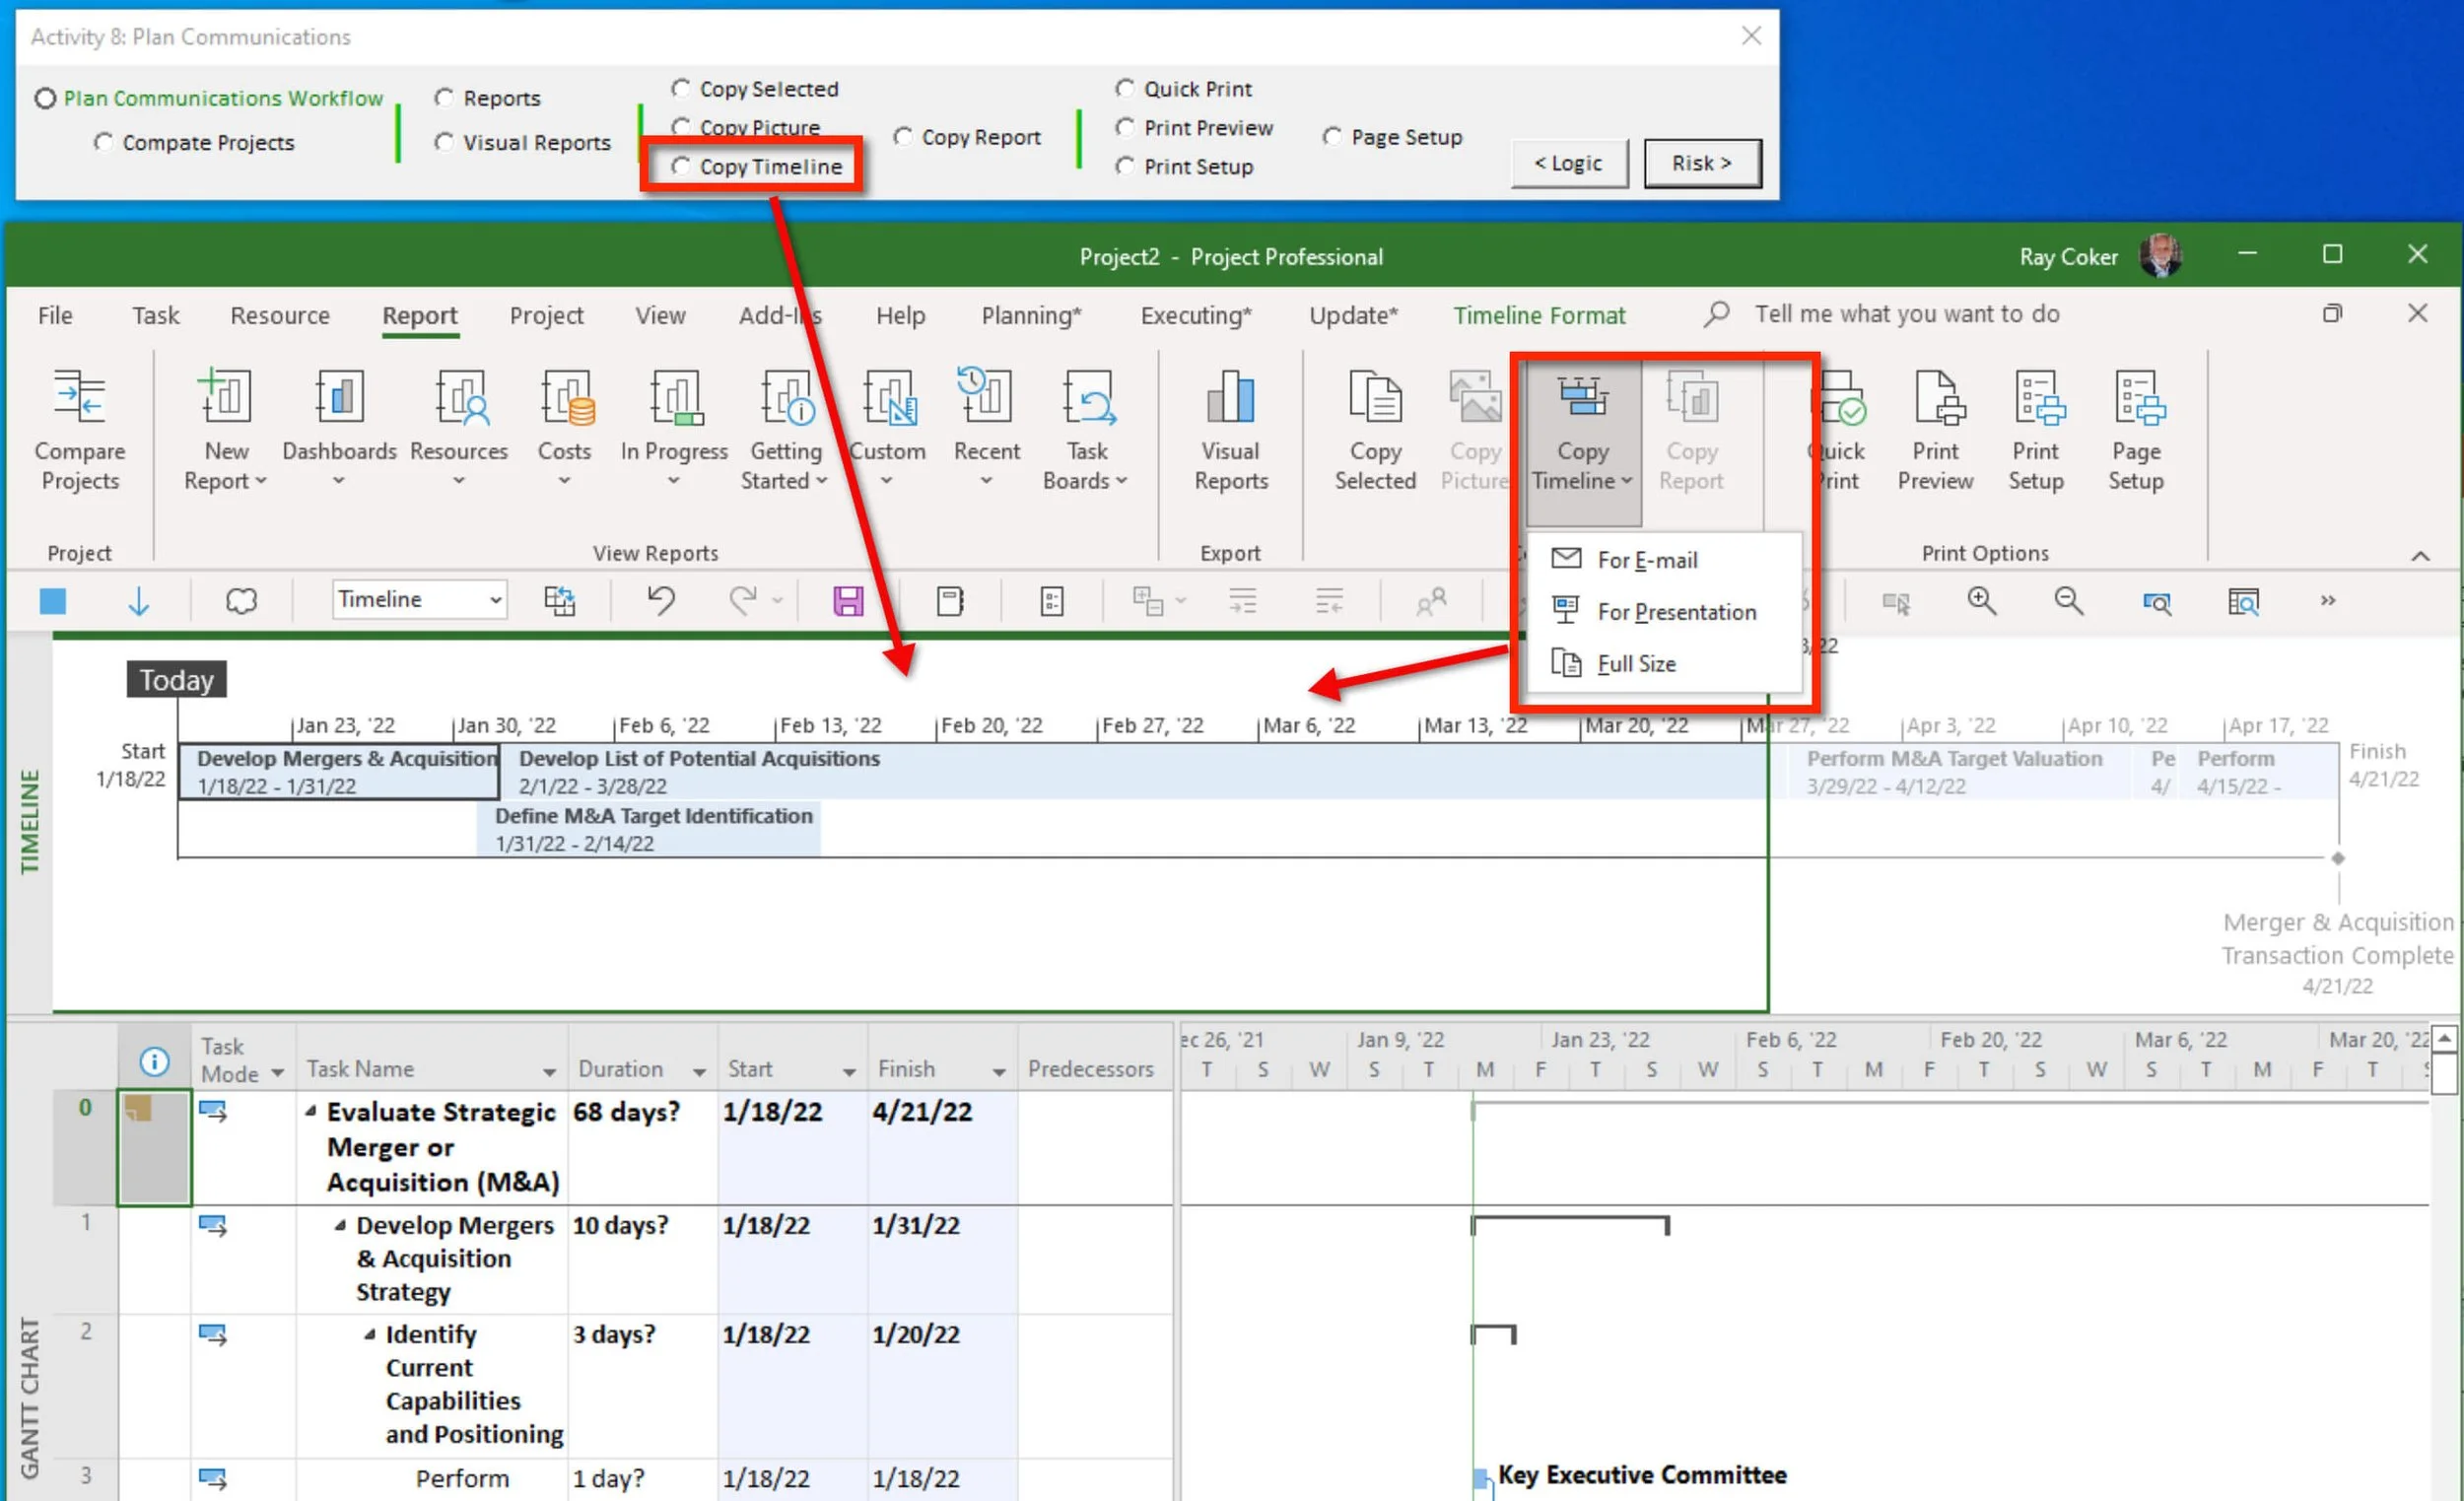
Figure 48. Copy Timeline view.
The Copy Report command will copy a Standard Report to paste into an email or document.
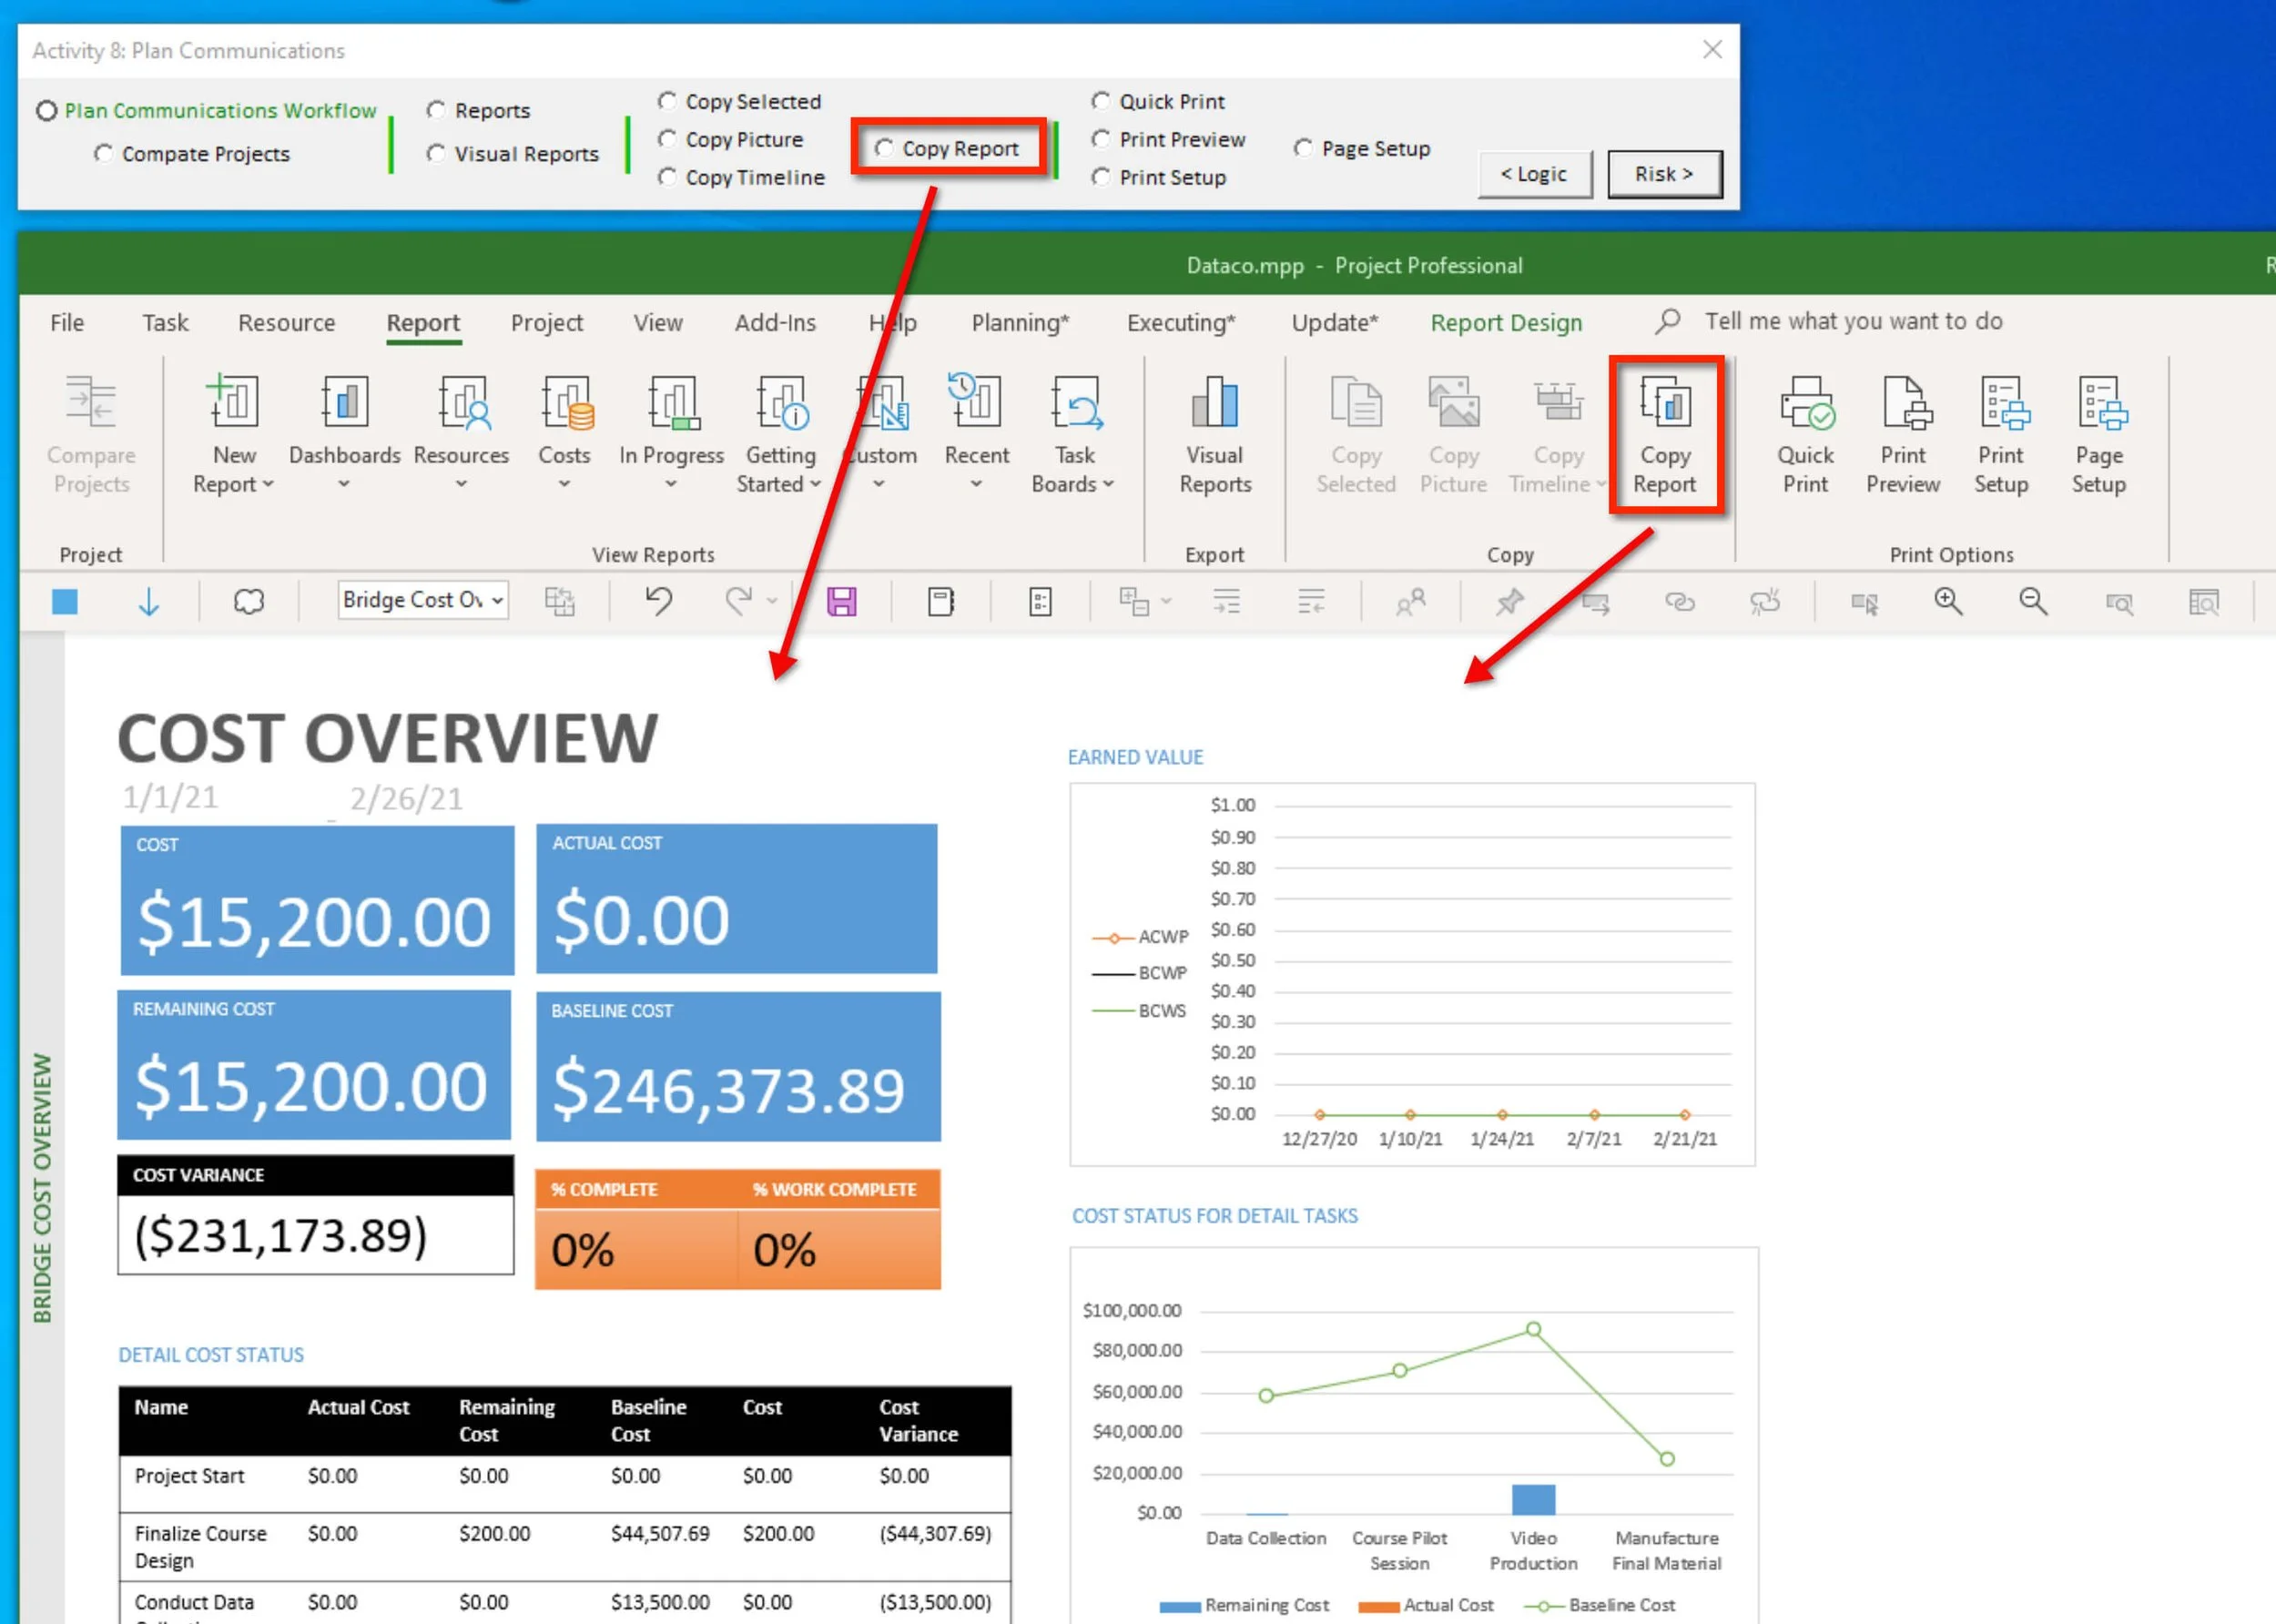
Figure 49. Copy Report
Printing Views
Eleven of the seventeen different types of views in Microsoft Project can be printed. All of these printable views can customized for reporting,
All of the print commands have been placed under the Report tab and the Plan Communication floating bar, except Save as PDF. When printing PDF, it is best to select a PDF printer driver like the Microsoft Print to PDF driver.
Print Preview is available for printing views and traditional reports. This command will open the Print page for a view of what the report will look like given the selected Printer driver. Several selections are available and Page Setup opened for additional print selections.
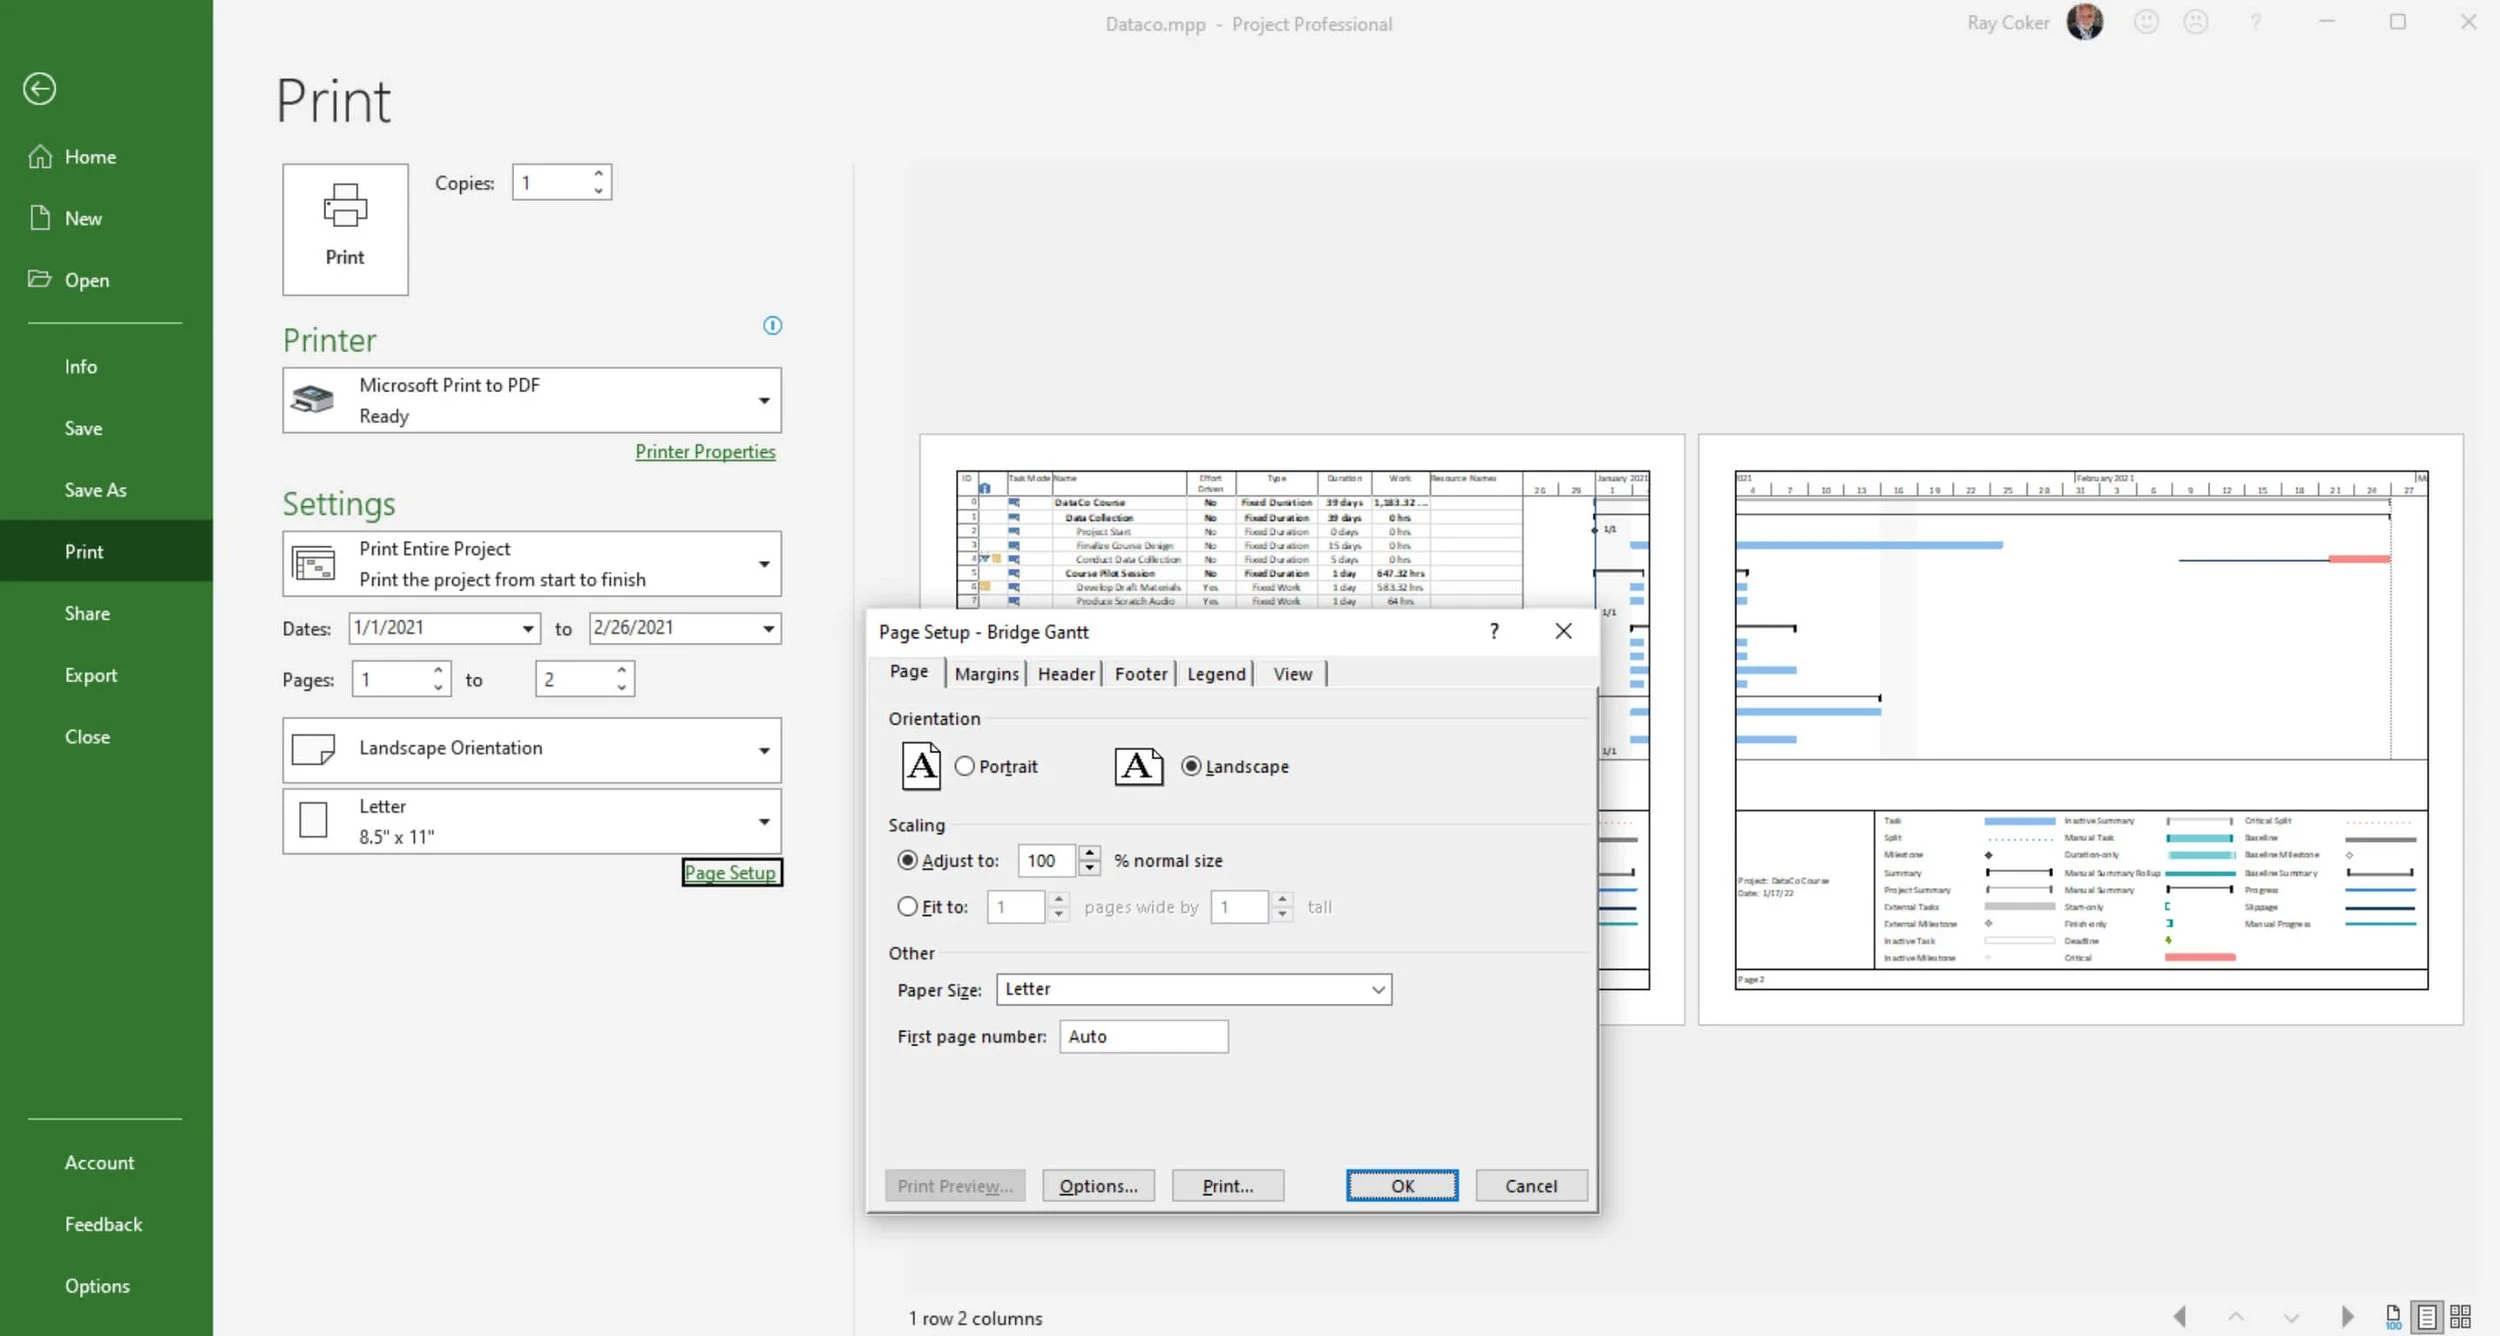
Figure 50. Print preview.