
Last Updated: March 24, 2022

Activity 10 - Acquire Project Team
Page Outline
Application 1 - Acquire Project Team Workflow
Activity 10 Workflow Simulation - 15 minutes
Acquire Project Team Content Links (jump to)
Application 2 - Understand and View Resource Workloads (jump to)
Managing Workloads Simulation - 30 minutes (jump to)
Application 3 - Automatically Level Resources (jump to)
Level Resources Simulation - 20 minutes (jump to)

Acquire Project Team Workflow
Review
Review and learn the Activity 10: Acquire Project Team workflow below.

Figure 1. Acquire Project Team in Project MAP.
This is Activity 10: Acquire Project Team Workflow in the Project MAP project lifecycle.
This MS Project Master Class Online Application is a return to two features we have worked with before; resources and master projects.
In addition, this is a detailed look at resource management and resource-leveling. These are both the top reasons people purchase Microsoft Project and the primary features most users never learn well enough to obtain any value.

Journal
Very few project managers assign skill or generic resources when estimating. Once the links are set between tasks, replace generic resources with the actual people doing the work and scheduling around availability. In all honestly, I have rarely done that myself. I know who my resources are; I don’t usually have the luxury of thinking about what skills are required and then searching for the people that match those skills.
Can you think of a better workflow for Activity 10, putting your team together, negotiating, and leveling workloads? If yes, what is that workflow?

Best Practice
Get in the practice of thinking about the skills required for resource assignments. Then work to acquire a team that represents those skills.
A primary skill in project management is quickly leveling the cityscape of resource assignments. Resource workloads often look like a cityscape. The idea of resource leveling is to smooth that cityscape, eliminating the peaks and valleys.

Figure 2. A cityscape is often used to describe resources that have not been leveled.

Figure 3. Activity 10 - Acquire Project Team

Download as PDF

Activity 10: Workload Simulation (15 minutes)
Before we get started on this simulation, open your MS Project Master Class Plan.mpp file. Using the Table of Contents in the Master Class Book and the Outline above, update the plan by:
Entering detail tasks for this Activity.
Entering duration estimates.
Assign yourself to each detail task.
Linking detail tasks.

Download as *.mpp
To start this simulation, download the Acquire Team Workflow.mpp file by using the icon above and opening it in Microsoft Project. Rename the project to 10 - 1 Aquire Team Workflow.mpp. Make sure your global settings in Project Options are correct and that you are using Microsoft Project 2019, 2021, or Microsoft 356 for best results.
As already mentioned, the project management idea is to plan with resource skills rather than people up to this point. Most of us don’t do that; we plan with the people on hand or in mind. The implications of planning with “skill in mind” are apparent. In the best-case scenario, we should ask, “What skill is required for this activity?” Not, “Who do I have available?”
The simple project you opened has five tasks and two skill resources assigned. The first step in the workflow is to replace these skill resources with actual people.
Open the Resource Sheet view and rename these resources with Ted, Susan, and Alice, in that order.
Ted replaces Project Manager
Susan replaces Software Engineer
Alice replaces Project Manager II
Project Example
In several Project Server deployments I have worked on, the organization maintained a resource pool of generic skill-based resources. At this point in planning, a skill-based resource, using a matching functionality, is paired or matched with the actual people in the organization with those same skills. The next step is to assess returned resources to check their availability to work on the project. Availability is reviewed with graphing or histogram functionality showing project commitments. An available skilled person is then selected to replace the generic skill-based resource.
Apply the Resource Graph view and then Zoom the Entire Project. This graphic clearly shows the allocation or workload for a selected resource.

Figure 4. Resource Graph view showing workloads on a daily interval of time.
Return to a Gantt Chart view.
Resource leveling means addressing periods a resource is over and under-allocated and leveling their workload, so they are not experiencing times of overallocation when the quality of work goes down, and delays are a common outcome of over-allocation. Resource leveling also means looking for ways to better or more fully utilize resources, enhancing potential project contributions before their time is squandered.
There are two ways to address overallocation, reschedule and reallocate.
In this project example, both Task 1 and Task 2 are coinciding, and it is easy to see why Ted is overallocated 100% during this period. Link those two tasks with a standard dependency. By rescheduling Task 2, the overallocation is resolved.
The other general approach is to adjust assignments. Open the Assign Resources dialog box and replace Ted on Task 2 with Alice.
Save the project.
Simulation Results
On Task 2, Alice replaced Ted on the tasks. Ted is no longer overallocation and Alice is less underutilized.

Figure 5. Replacing resources.
Apart from resource leveling, the last part of this Activity 10: Acquire Team workflow, is deciding how the team is going to work together. Microsoft Project has been a large part of how teams work together for many organizations.
Project Example

I fell in love with Hoover Dam when I was a small boy, so I jumped at the opportunity decades later to do some project management work for the dam. Especially since the Gantt Chart and an early version of portfolio management, with large independent projects coinciding and in sync, are part of Hoover Dam history.
The International Association of Project Managers writes that “The Gantt chart is named after American engineer and management consultant Henry L. Gantt, who used it to provide a visual picture of the Hoover Dam project so that everyone involved could see when the individual construction phases were scheduled to take place.”
The Chief Engineer for the Six Companies involved in building the dam was Frank Crowe. The dam was going to be the biggest globally, creating a lake 150 miles long and 580 feet deep. The location of the dam was isolated in the desert without infrastructure, transportation, or housing. Besides Crowe’s managerial and engineering skills, his organizational genius was managing multiple significant projects simultaneously.

When I was working on Gantt Charts for the maintenance department at the dam in 2007, Michael Bay and Steven Spielberg were filming Transformers, the American action film based on the Transformers Toy line. At the same time, the government was constructing another large project, the Mike O'Callaghan–Pat Tillman Memorial Bridge, which was the first concrete-steel composite arch bridge built in the United States. This bridge incorporated the widest concrete arch in the Western Hemisphere. At 890 feet above the Colorado River, it is the second-highest bridge in the United States and the highest concrete arch bridge. There is a bronze Gantt Chart at the bridge of this multi-year project.
At Hoover Dam, there are 17 main turbines in the Hoover Powerplant -- nine on the Arizona wing and eight on the Nevada wing. When a generator goes down for scheduled maintenance, a Gantt Chart is printed out and hung from the side of a generator housing. The maintenance manager frequently updates the plan and reprints the chart. Team members use the large printout to determine what they should be working on during any given shift.
We were building workload simulations. When a generator would go down for general maintenance, it had to be completed on time. In the past, they had done what most organizations do on large capital projects when they fell behind schedule - they would assign more resources. I was there to help them do that more efficiently using Microsoft Project. We created expert plans, mock scenarios, shift work, and resources by skill working the various schedules. At times, we would assign an entirely new shift to critical tasks, increase costs by $20,000 and only gain 10 minutes on the schedule. Making new assignments and evaluating the actual impact on the schedule was invaluable information.
I don’t know of any software other than Microsoft Project and a few high-end project management tools like Primavera that can do this type of analysis.

A second objective of the work I was helping the dam with was to capture “expertise in a plan.” My contact, the prime maintenance manager, was considering retirement after more than 30 years at the dam, so he built a knowledge base of plans. A bonus for me was that this manager, who loved the dam and knew everything about it, took me everywhere.

If you are working with a coach, save and send them this file (10 - 1 Aquire Team Workflow.mpp should have no resource overallocation) to review. If are planning to apply to either MS Master Class certificate, archive this completed simulation file so that you can submit it for review.

Return to the Master Class Book and review the next section
Content Links

Like Resource Leveling, this feature has been a staple of project management software since the mid-1980s.
Sharing resources across multiple projects and then combining those projects into a master project has been a handy tool over the years.

Best Practice
Sharing resources and combining projects in a master project has some practical limitations. This feature is not an enterprise-type functionality and has a practical upper limit of a few dozen projects with a few hundred tasks each. But, on a small scale, an invaluable feature.

Back in the mid-80s, software development rapidly solved problems and perform tasks in minutes or hours that once took days.
When Resource Leveling was first available for project managers using a PC, a 1,200 task schedule with moderate resource overallocation took 24 hours to level resources.
The software reviews literally “went nuts” about how great that was. There was this implicit promise that you could just sort of plan however you wanted, and the software would untangle the mess and resolve all of your resource conflicts. This was a fascinating idea for many people.
As it turns out, Resource Leveling has never been a magic bullet, but most people give up on the feature without discovering those circumstances that could make it valuable. At the same time, under some instances mentioned in the Master Class Book, some project managers have accomplished incredible things using this feature.

No one has unlimited resources. The better people plan, the more they realize they need to address resource overallocation and underutilization.
As a project is looked at from different angles from different views, Microsoft Project does a great job identifying resource allocations over time.
Four views are almost exclusively dedicated to viewing resource workloads:
Team Planner view
Task Usage view
Resource Usage view
Resource Graph view

Best Practice
Master the different types of views in Microsoft Project so that you can quickly switch from view to view to manage resources.

Understand and View Resource Workloads
In this application we are going to look these three things:
Replacing generic or skill resources
Viewing resource workloads
Reassigning resources or modifying activities around resource availability
Review
Review the Content Link above on Resolving Resource Overallocations. (jump to)

Managing Workloads Simulation (30 minutes)

Download *.mpp file
To start this simulation, download the Acquire Team.mpp file by using the icon above and opening it in Microsoft Project. Rename the file to 10 - 2 Acquire Team.mpp. Make sure your global settings in Project Options are correct and that you are using Microsoft Project 2019 or 2021 for best results.
Replace Generic or Skill Resources
The first thing to do is replace the “skill” resources with a team of people. Apply the Resource Sheet view and make these changes:
Sponsor = Wendy
PMO Director = Susan
PM Consultant = Ariel
PMO Staff = Floyd

Figure 6. Skill or generic resources replaced with the actual people doing the work.
Defining an Actual Person’s Availability
After replacing “skill” resources with the actual people doing the work, define each person’s availability. Keep in mind that now you are dealing with resources that have commitments to other projects, line activities, time at the “water cooler,” conferences, training, and life experiences like vacations, maternity leave, and accidents and illnesses. Address resource availability by making the appropriate changes to their:
Calendar
Exceptions to the base calendar
Max Units
Contour of availability
Let’s make some adjustments to Wendy’s availability:
First, Wendy will not be back from the holidays until January 5th, so block off these dates in January (1/3-4/2022).
Next, Wendy is available full-time for meetings and to kick off the project by spending several days determining the outcomes and scope of the project and aligning those with the business. Still, she isn’t available more than a few hours a week. Leave her Max. Units at 100% against her Standard base calendar but then contour her availability to 25%, beginning 2/1/2022.
Simulation Results
Wendy’s availability should be defined by the Resource Avalability contour below, and the holiday exception in her calendar.

Figure 7. A resource’s availability defined by Max. Units, the Resource Availability contour and Exceptions to the base calendar.
You get a message that the duration of a Fixed Duration task has been changed to accommodate this change. The task was 3.17 days in duration and it has been changed to 5.17 days to accommodate Wendy’s availability.

Figure 8. Scheduling message.

Figure 9. Duration adjusted based on resource availability exception against their base calendar.

Warning: Changes to duration have been a significant change, in the last couple of Microsoft Project versions, to Fixed Duration / Not Effort Driven tasks. The duration of these tasks is no longer Fixed. There are circumstances where the software changes the duration when the rule is fixed. This change to duration is a good illustration of the reality of using Microsoft Project; the rules bend and change over time with the release of updates and versions, even when many users would prefer that those rules do not change.
Examine Resource Workloads
The next step is to evaluate resource workloads. Insert the Peak field, and you can see that at some point in time (this could be during a 15 minute period) one of the resources is double-booked, and two resources are triple booked. All of the resources are highlighted in red, indicating the resources are overallocated. The indicators column also displays the overallocation indicator.
There is no other information related to workloads in the Resource Sheet view. A closer look at resource over allocations must be observed and untangled in different views like the Resource Graph or Resource Usage views.

Figure 10. Peak % assigned field in the Resource Sheet view, identifying the highest units assigned during a period of time.
Apply the Gantt Chart view. The Gantt Chart view identifies which tasks are associated with over allocations, and the dates of these tasks tell us where to look.
Wendy needs to be there for this first task, so we have no choice but to delay the project before it even starts. The best way to do that is to change the project start to 1/5/2022. We already know that Wendy isn’t coming back from the holidays until 1/5/2022, so we might as well make that change to the overall schedule.
Let’s simulate something about general shifts in a schedule first. Before changing the project Start date in Project Information to 1/5/2022, go to Options / Schedule and turn Calculation Off at the bottom. Then enter 1/5/22 in the Start date field in Project Information. Notice the schedule does not shift; the Project Start milestone is still 1/1/22. We know it did not change to 1/5 because we turned off Calculation.
When a task or tasks do not appear to be scheduled correctly, there are five things to check:
The project or task calendar.
Calendar options for the project in Options / Schedule.
Timing constraints.
Check to see if Resource Leveling is set to Automatic.
Make sure Calculation is On in Options / Schedule.
Correct the problem by turning Calculation (a global setting that applies to all open projects) back On, and the Project Start task starts on 1/5. Then change the duration of Determine outcomes & scope that Microsoft Project changed to 5.17 days when Wendy’s availability was adjusted, back to 3.17 days.
Also, notice the timing constraint on PMO complete. There is a Must Finish On constraint of 5/3/22. If you insert the Total Slack field, you will note that the schedule has several days of negative slack, so let’s make that correction by delaying the finish date. For the PMO complete task, go to Task Information / Advanced tab, and change the MFO date to 5/5/2022.
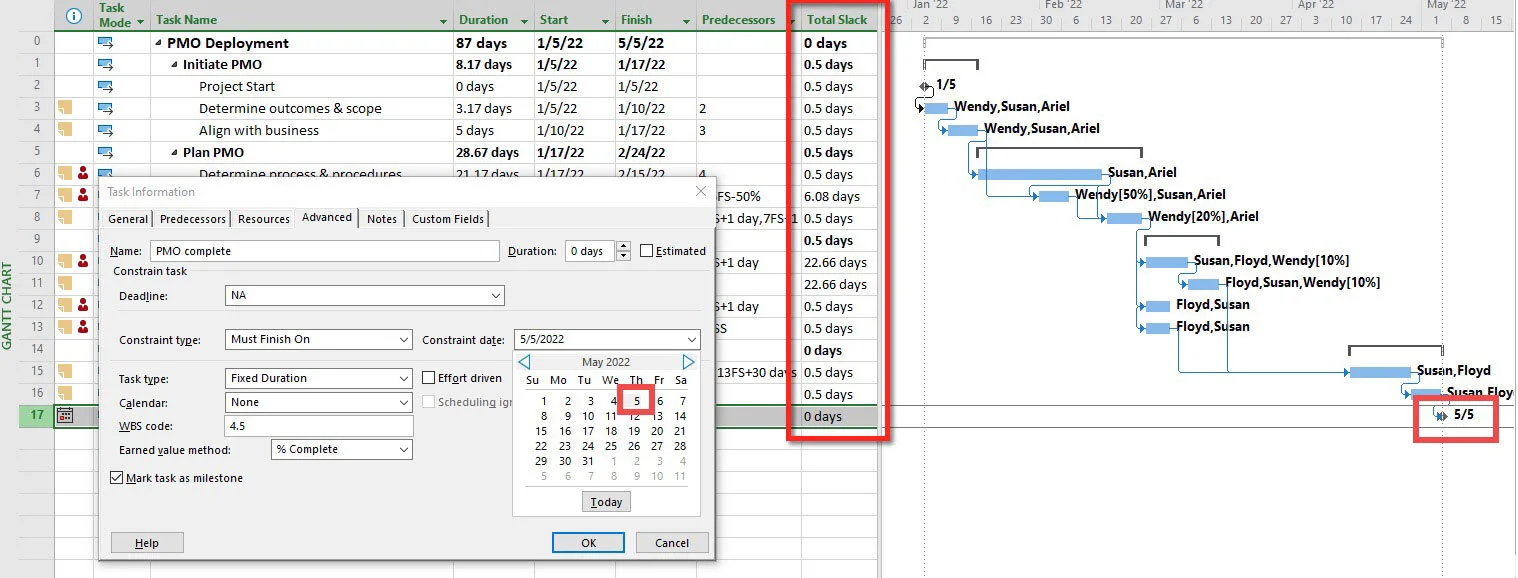
Figure 11. Adjusting the end date of the project to remove negative slack.
From the Gantt Chart view, we can see the tasks involved in the over allocations and we get a pretty good sense of the general time period, in this example last part of February and the first part of March, we need to look at closely to resolve these resource conflicts.

Figure 12. Tasks in a Gantt Chart view that display the overallocation indicator.
Apply the Resource Usage view. Adjust the time scale to week periods, because let’s say, that is the unit you are concerned about regarding over allocations. Then scroll to 1/30/2022 and make some of your observations and perhaps decisions.
Add these details and color the backgrounds so that the rows are distinctive and shown in the figure below:
Work
Work Avail.
Rem. Avail.
Overalloc.
Unit Avail.
For example, you might make these observations:
As you already know, the resources are overbooked in February.
Wendy is overallocated during the first part of February, and her over allocations are minimal, so we will not worry about it. We already rescheduled the project around her availability by delaying the project start date and changing the constraint date for the last task.
Susan and Ariel are significantly overallocated during 1/30 and slightly overallocated during 2/6.
Ariel is significantly overallocated during 1/30 and then not used at all beginning 2/20.
Susan and Floyd are seriously overallocated during 2/27.

Figure 13. Resource Usage view showing over time: Work assigned, the Work Available, the work Remaining Available, the work Overallocated and the Units still Available.
Select Wendy and then Apply the Resource Graph view. Zoom the Entire Project, set the timescale to weekly, and then scroll through the resources.
Susan has the clear-cut case of the bottlenecks. There is a two-week period that it is not humanly possible to complete her assignments.
Split the window and apply the Gantt Chart on the bottom view. Then scroll to 1/30.
It is clear which assignments contribute to Susan’s overallocation, as shown in the following screen.

Figure 14. Spilt window with the Resource Graph view on top and the Gantt Chart below.
Let’s start addressing some of these more severe resource conflicts. Susan is assigned to ID #6 and #7. These tasks overlap.
Please take a minute to look at her assignments for both tasks.
We will have to change the schedule, adjust her assignments, or a combination of both. Let’s say the best solution is to get rid of the overlap. Double click on #7 to open task information and remove the lead for Determine process & procedures by entering 0 in the lag field under the Predecessors tab.
The scheduling message below appears. This message is poorly written but still lovely to get. This message would have told you where to look for the problem in previous versions of MS Project. For now, remember the scheduling message associated and remember to look at the schedule to determine what has happened.

Figure 15. Scheduling message.
Before looking for the scheduling problem, notice that you have resolved the overallocation for Susan during this period.
As is almost always the case, when you address an issue, such as timing, cost, resources, or scope, you create another issue that you have to address. Poor project managers spend much of their time putting out fires. It could be because they lack skills or are working for an organization that poorly plans or executes. Good project managers problem solve. They realize there are constant changes, disasters, challenges, and obstacles.
Project Example
I was living in Atlanta during the 1996 Summer Olympics. A few months before the Olympics, it appeared as if many of the venues would not be finished in time. I remember watching the lead program manager interviewed by a room full of press. The press asked several pointed questions about completing on schedule. He calmly answered each question with, “We have looked closely at that. We have planned, and we are prepared. Even though it might not appear as though we will not be ready, we will finish on time.”

Note: This is what we want; we want to see how changing one aspect of the project’s “Triple Constraints” impacts the other elements of the project’s “Triple Constraints.” Observing how one change impacts other constraints is the primary reason for managing the “Triple Constraints” in project management software. If we are only managing schedule, as do most Microsoft Project users, we do not immediately see the full impact. To fully use Microsoft Project to maximize your effectiveness in managing a project, manage all of the project constraints of time, resources, cost, and scope in the software. Even if, for instance, the actual “budget” is handled elsewhere.
The best view to apply is the Gantt Chart view to address scheduling problems. #6 and #7 are no longer overlapped in the Gantt Chart view, but what was the scheduling message trying to tell us? Look at the last task, and remember the constraint on that task. Then insert the Total Slack, and the problem is more apparent; there are 4.45 working days of negative slack on the last task created by the slip in the schedule. The project needs to be brought in to resolve this scheduling problem.
Typically, when you adjust one project constraint, such as getting your budget trimmed or losing a valuable resource, you have to compensate somewhere else.
In this case, look at the lag between Establish performance metrics and Obtain feedback. Perhaps the initial thinking was to put that much lag there to increase the quality of input obtained. Reducing that lag would reduce the scope or quality of the project if it hinges on the quality of the feedback, but it seems to be the best way to address this scheduling problem. But how much do you reduce this lag? Well, the Total Slack field tells you 4.5 days.

Figure 16. Changing a link between task in order to resolve a resource conflict.
Change the lag to 25.5 days. Notice the Total Slack is now zero, and the scheduling problem was corrected.
Go back to the Resource Usage view, with the Gantt Chart view on the bottom of a split window. Select Susan, and we can see that the next problem we need to address is her assignment to three tasks coinciding. In addition, notice that Floyd is assigned to these three overlapping tasks, too, and Ariel is available during this period.

Figure 17. Split window with the Resource Usage view on the top and the Gantt Chart view on the bottom, illustrating the availability of a resource during a period another resource is overallocated.
So let’s do these three things:
1) First, let’s remove the overlap between ID #12 and #13. It would be nice to do these together; we can’t staff the tasks with the same people.
Insert the Total Slack field, and #13 has 0 days slack, so we know that changing/delaying that task will delay the project. But go ahead, double click #13 and change the type of dependency from a Start to Start to a Finish to Start.
2) Then, with the Gantt Chart view selected below, open the Assign Resources floating dialog box (Resource tab / Assign Resources command) and do the following:
Replace Susan on #10 and #13 with Ariel. Susan’s overallocation is resolved. Ariel now has a heavy work week on 3/6, but it is low enough for her to level. The following week she has a low assignment, and then she is open.
3) Select Floyd. He is overallocated the weeks of 3/6-3/13. Suppose both Susan and Floyd had wanted to work on Establish monitoring criteria, but now it doesn’t seem practical given the over allocations. Let’s let Susan do the bulk of the work. Reduce Floyd’s assignment on #12 and #13 to 10%. That keeps him involved but doesn’t require a lot of work. That brings down his overallocation to something he can manage.

Figure 18. Example of resources still overallocation, but workloads leveled to the managers satisfaction.
In this simulation, we have resolved (to our satisfaction) the resource conflicts, and we have addressed some of Ariel’s underutilization. Let’s take a final look at the schedule by applying the Gantt Chart view. There are still over three days of negative slack. Shorten the lag of Obtain feedback to 22 days.
Now the schedule looks good.
In summary, we resolved the serious over allocations in the schedule. The project is only finishing a couple of days later (5/5 vs. 5/3) than when we started trying to schedule the actual people doing the work. We have a small amount of Total Slack built into the schedule, but we can redefine Critical Path in Options / Advanced to 1 days. This is done on the Tasks are critical if slacks is less than or equal to: selection at the bottom of that dialog box. Change the definition of the critical path, and then show Critical Task (Format tab / Bar Styles group / Critical Tasks checkbox command) and notice there is now a clean Critical Path flowing through the project.
Save the project.
Simulation Results
Your simulation project should look like the one in the following figure. The project is 87 days, starts on 1/5, and finishes on 5/5. The critical path is redefined, although the software still shows resources as overallocated. However, none of those over allocations are viewed, hypothetically, by the project manager as serious.

Figure 19. Resources leveled, new critical path no negative slack.

Journal
The first question is about this idea of resource-leveling. In manufacturing, where a product line cannot be overallocated is one reason for leveling. But often, the other reason is protecting the manufacturing line from overuse. American management history reminds us that plant managers ruined multi-million-dollar facilities with overuse and neglect. Today, resource leveling is also about preserving those valuable machines. They go down for scheduled maintenance; maintenance has a higher priority than production. What is the general idea of resource management or resource leveling?
Regarding leveling in Microsoft Project, what are the key ideas you need to understand?
1. Can you define these terms?
Resource Availability
Resource Availability contour
Base Availability
Base Calendar
Resource Calendar
2. Can you explain the type of data in these fields?
Work
Max Units
Overalloc.
Peak Unites
Rem. Avail.
3. Which views focus `primarily or solely on viewing and managing resource workloads?:
4. If you need to address an overallocated resource, what are your options?

Best Practice
Think of resource leveling as playing a strategic game like chess. There are many moves you can make to accomplish your goal. Some sequences of moves are certainly better than others. In games like chess, you need to see the board in your head, and you need to be able to think ahead. It is the same in Microsoft Project. You have to see what is happening in the schedule as you make your moves, even though all of the data may not be available in the current view. The more you practice leveling resources, the better you will get.
Make notes of each move with a pen and pad as you make your moves to adjust the project to resolve resource workload issues.

If you are working with a coach, save and email them this file (10 - 2 Acquire Team.mpp should look like Figure 19).
If you are not working with a coach and you are planning to apply to either MS Master Class certificate, archive this completed simulation file so that you can submit it for review.

Return to the Master Class Book and review the next section for this Activity.

Automatically Level Resources
Although rarely used successfully, expectations for automatic resource leveling are typically disappointing. However, we believe that under a specific set of conditions, automatic leveling can be very successful, and a hybrid approach could be effectively used by almost anyone.
Review
Review the Content Link above on Resource Leveling. (jump to)

Level Resources Simulation (20 minutes)

Download *.mpp file
To start this simulation, download the Resource Leveling.mpp file by using the icon above and opening it in Microsoft Project. Rename the file to 10 - 3 Resource Leveling.mpp. Ensure your global settings in Project Options are correct and that you are using Microsoft Project 2019, 2021, or Microsoft 365 updated for best results.
This 10 - 3 Resource Leveling.mpp is a project almost exactly like the project we were working with above before we manually leveled resources after you did the following:
Replaced the skill resources and defined Wendy’s availability.
Changed the start date to 1/5/22 and changed the duration of the tasks are rounded.
We already know there is not a lot of slack in the schedule, so the Must Finish On constraint has been removed on the last task because we know leveling is likely going to push out the project end date. Automatic resource leveling will delay the project and may only be an appropriate feature to try if the finish date can be reasonably extended.
A hybrid approach is the best one to take when using automatic resource-leveling. First, if you have available resources, replace overallocated resources and then try automatic leveling. Make a few adjustments, level, remove leveling, make a few more adjustments, level again. Try a couple of iterations of this.

Note: We can do most of our work just in a Gantt Chart view. We can see the two areas where we have conflicts by looking closely at our schedule. Once we become familiar with Microsoft Project and see the board in our heads without looking at it (like in chess), we don’t have to hop around as much.

Figure 20. Tasks that have resources assigned that are overallocated during their task assignments.
Open the Assign Resources floating dialog box and select tasks #6 and #7.
Reduce Susan and Ariel’s assignment to each task to 50%. We know Wendy is only available at 25%, and she really should be assigned to both tasks, so assign her at 12%.
Floyd is available, so assign him to both tasks at 50%.
That resolves the conflicts on these two tasks. Notice the overallocation indicators are gone.
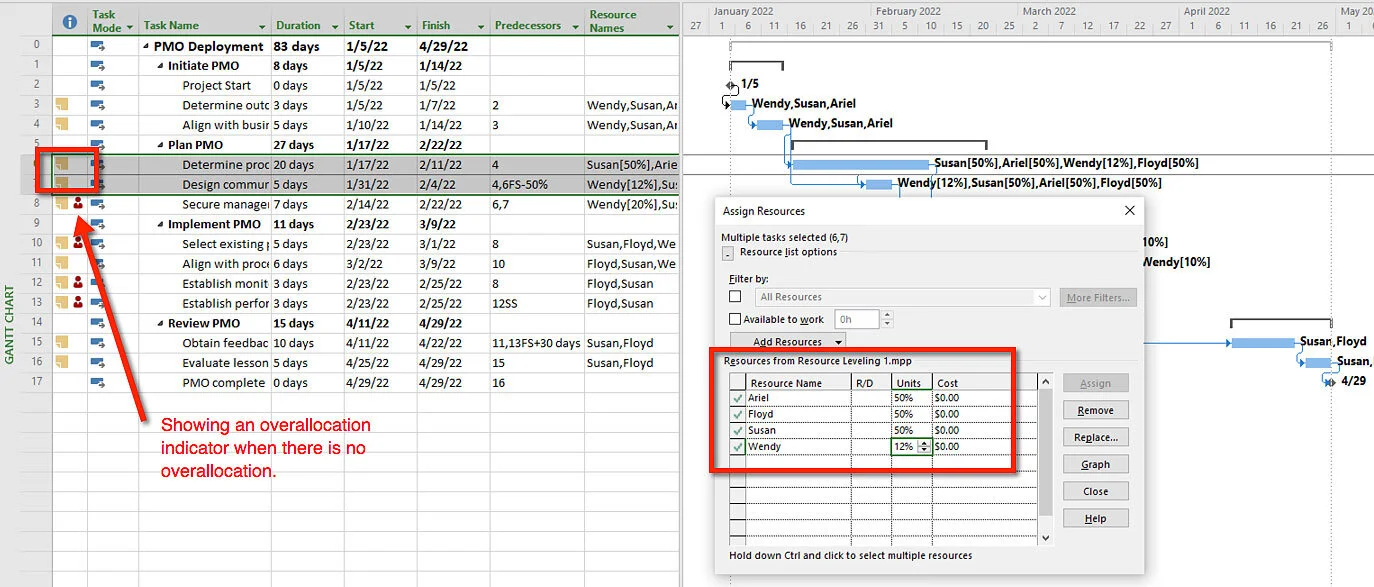
Figure 21. Resource overallocations resolved by adjusting assignments. Also incorrectly displaying overallocation indicator.
Next, since we are attempting to utilize resources better, let’s use this opportunity to shorten the schedule a bit. First, overlap the last two detail tasks by making the dependency an 15FS-4 days. Wendy should be assigned to #15 and #16 at 12%. Assign Ariel to both tasks at 50% and reduce the assignments of Susan and Floyd to 50%.
These steps shortens the schedule by several days, and the assignments are improved. In addition, when thinking about it, it would be good for the entire team and the customer to be involved in these last two tasks so an assumption might be that performance has increased.
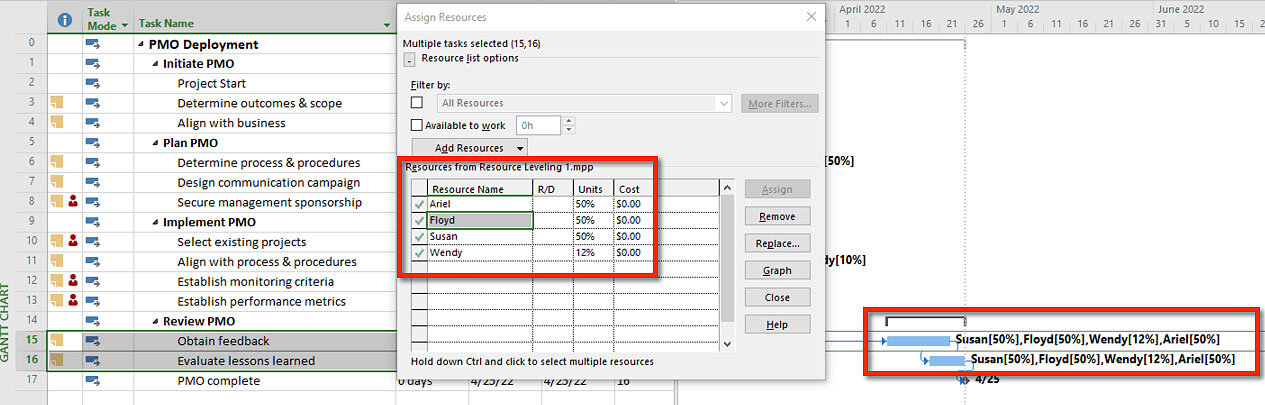
Figure 22. Example of tasks overlapped and then adjustments made to assignments to resolve resource overallocation.
Select #12 and #13 and assign Wendy at 10%, Assign Ariel at 50% and change the assignments of Floyd and Susan to 50%.

Figure 23. Example of resource assignments adjusted to address resource overallocations.
Then automatically level the remaining overallocations.
First, add the Leveling Delay and Total Slack columns.
Notice the three tasks under Implement PMO shown below that have resource overallocations. One task has 22 days of Total Slack, but two tasks have zero slack so leveling could delay the project.
Click the Leveling Options command on the Resource tab and make the selections in Resource Leveling dialog box in the figure below.
Clicking the OK button will save your selections in this dialog box. In this case, select Level All to level.
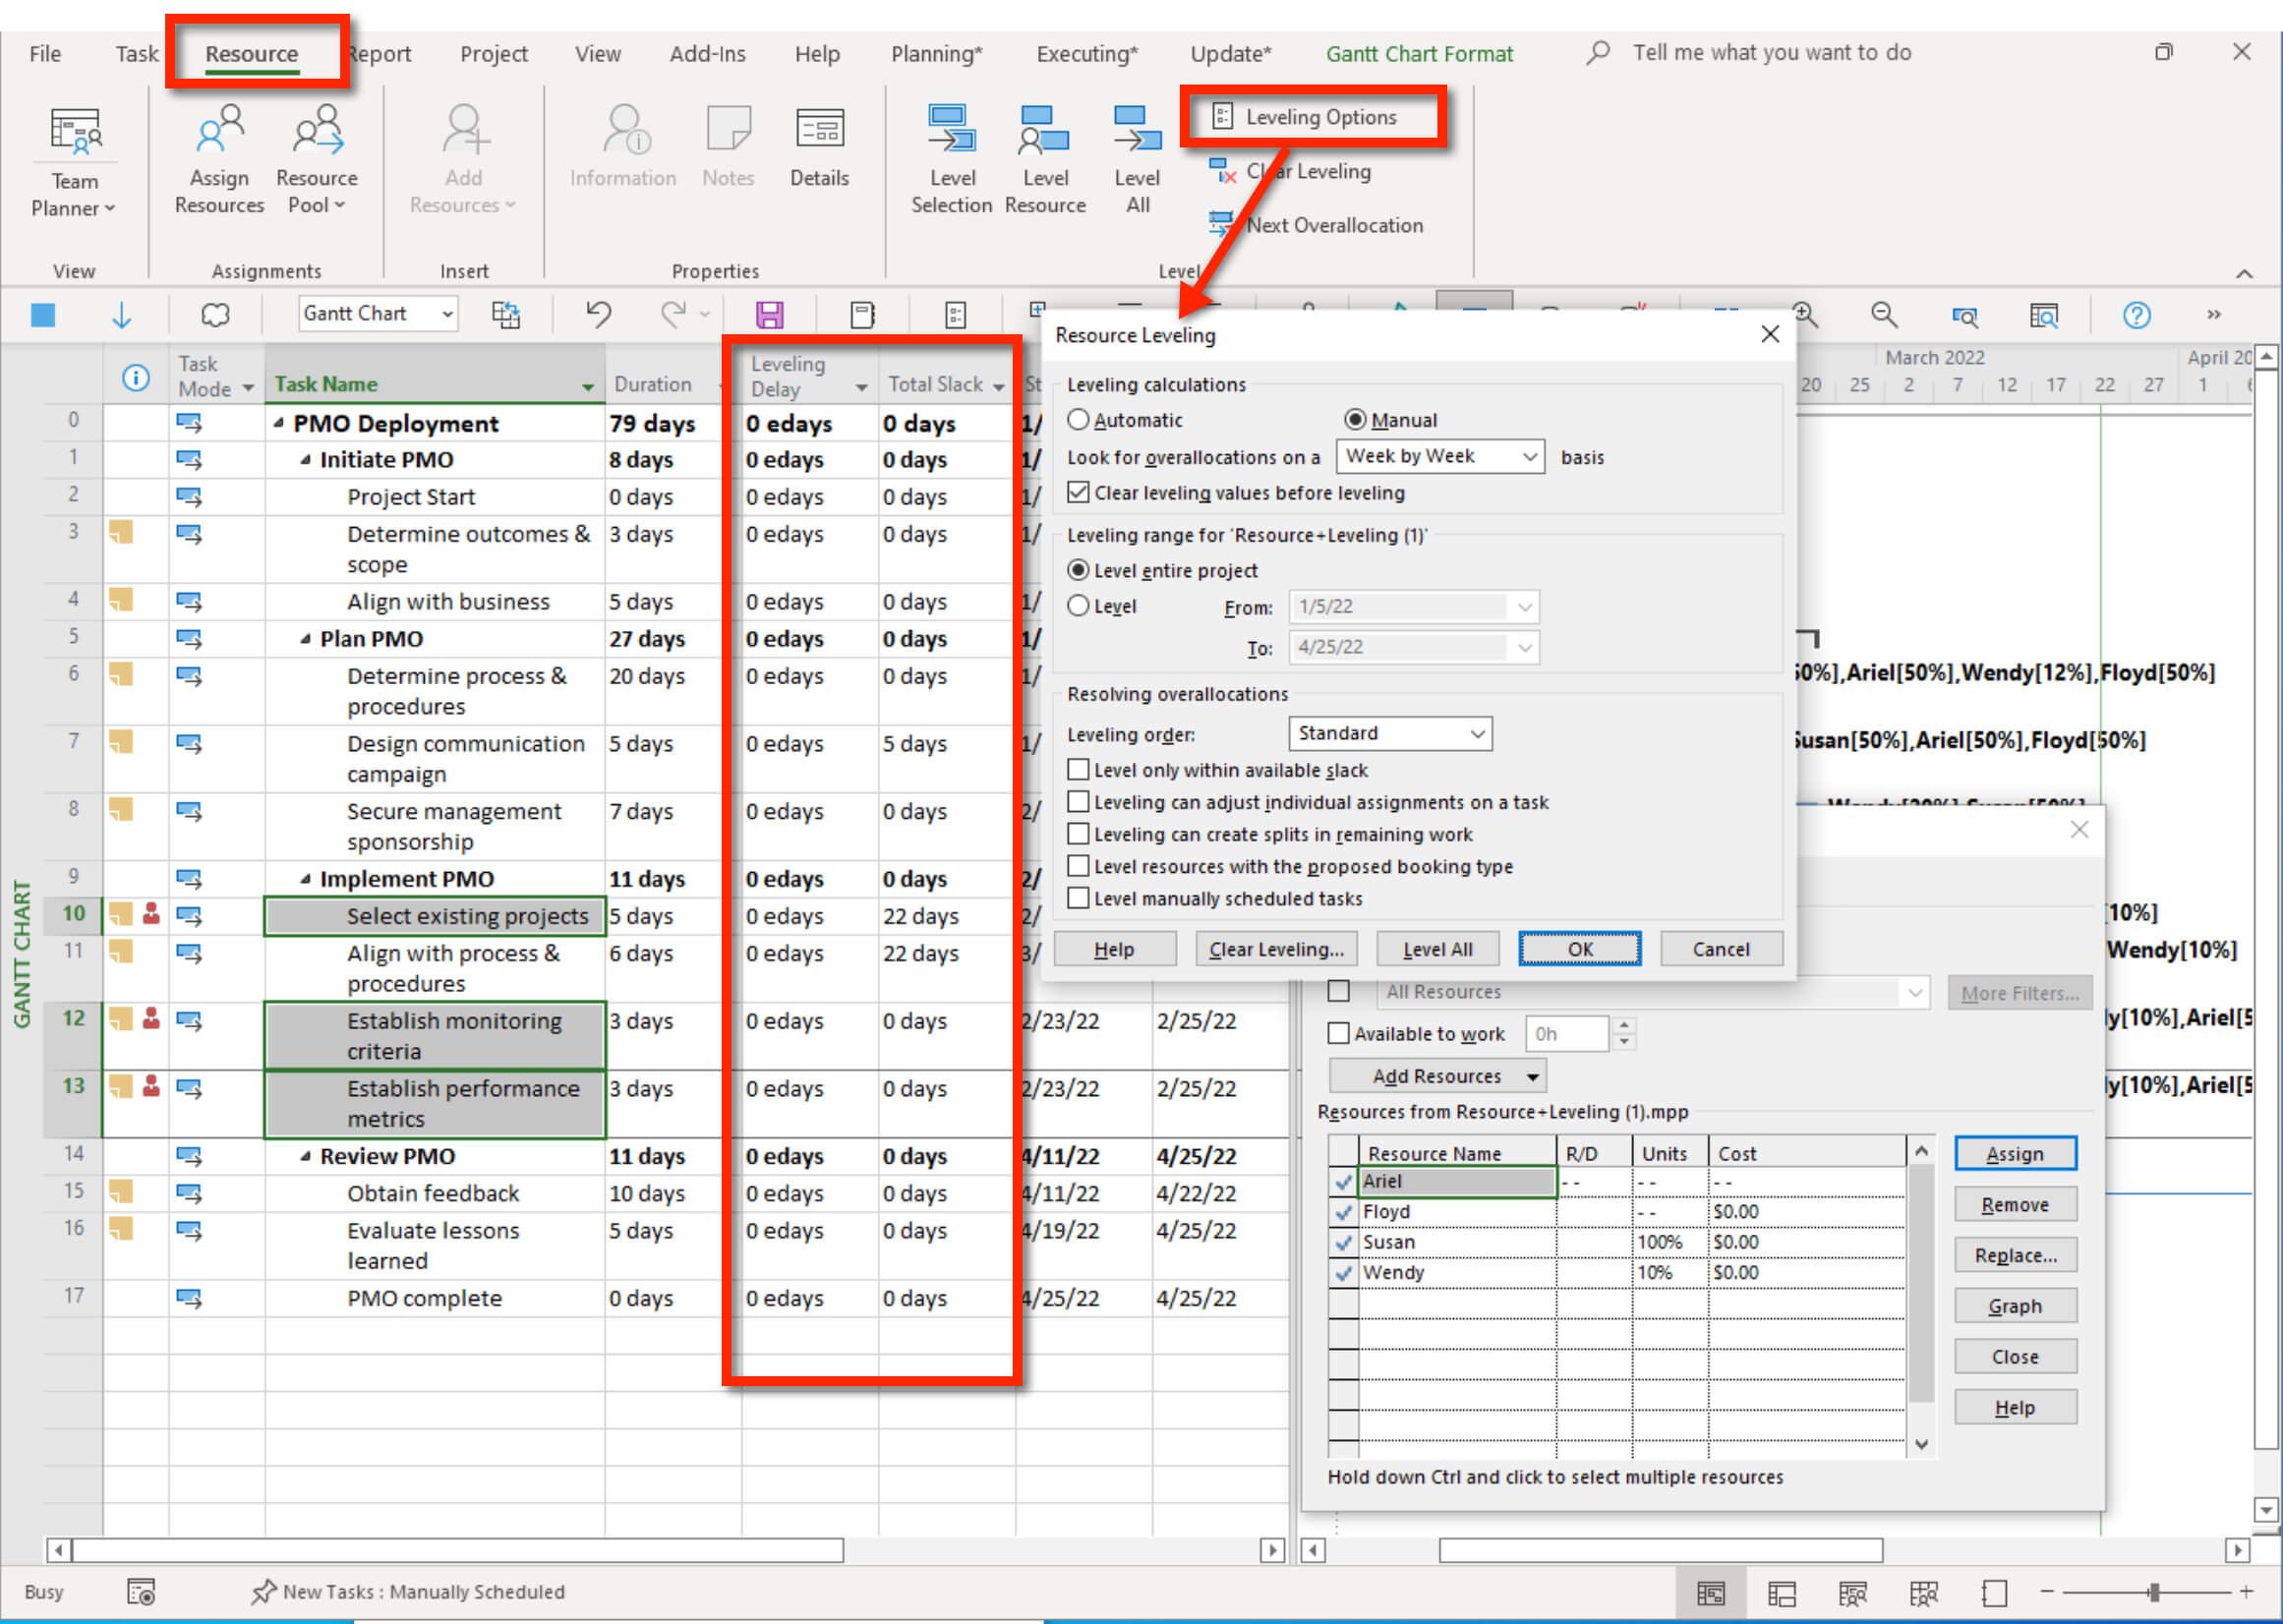
Figure 24. Resource Leveling options.
All of the schedule changes made by resource leveling are temporarily highlighted in blue. The Leveling Delay field show how much as task has been delayed by automatic resource leveling.
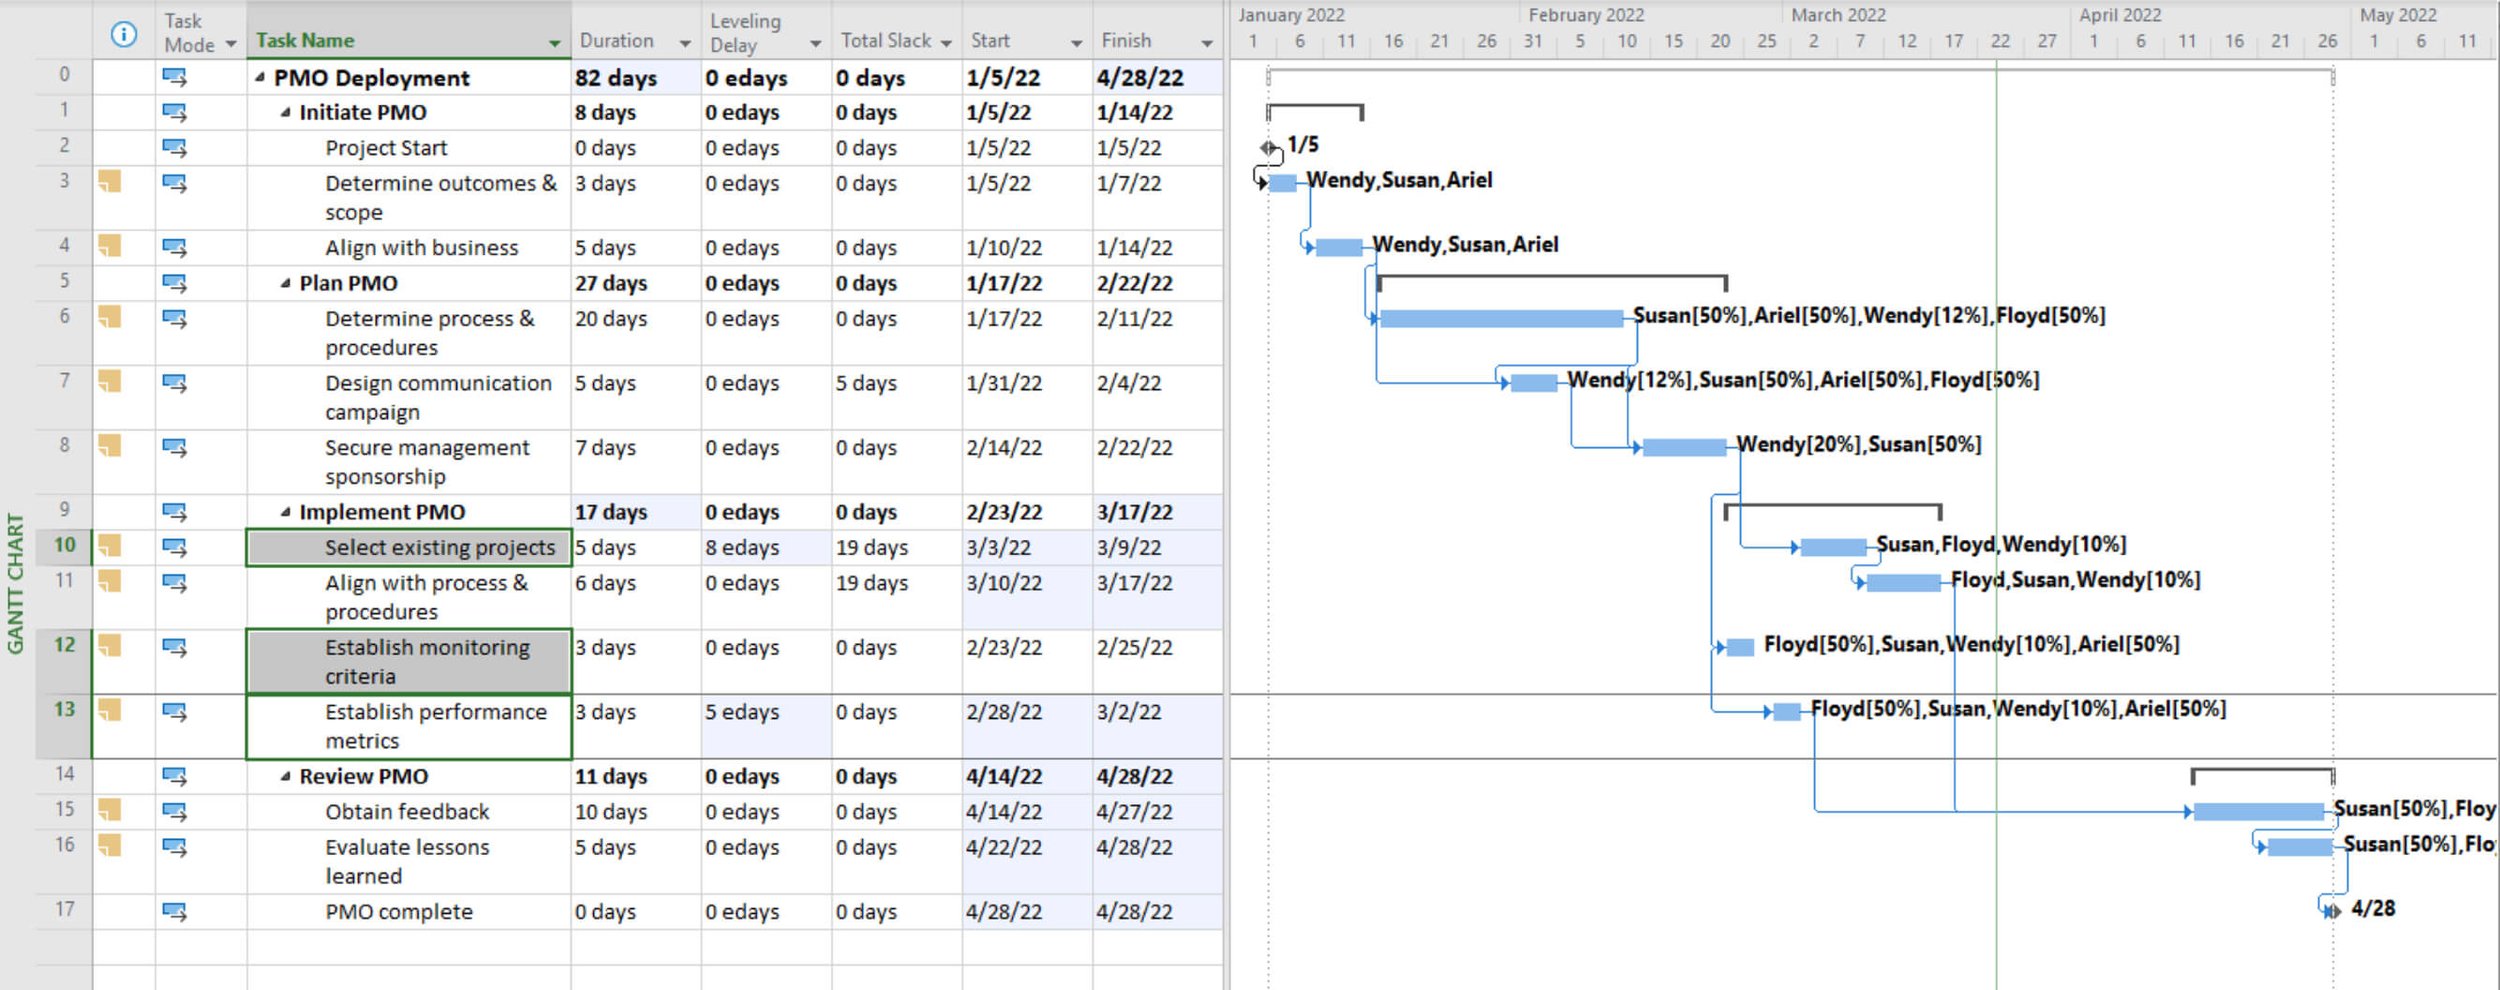
Figure 25. All resources leveled using a hybrid approach.. Resources better utilized and finishing a few days earlier.
All resources are now leveled.
Format the Critical Tasks and save the project.
Simulation Results
For the 10 - 3 Resource Leveling.mpp file the project no longer has any overallocation. Perhaps, because of the version of Microsoft Project that you are using the steps you followed, your timing may be slightly different than those in the figure below.
Figure 26. Hybrid leveling, some leveling is manual and some automatic.

Journal
Under what circumstances might you see yourself using the resource leveling functionality?
Although rare, some people swear by automatic leveling. Can you think of any reason why someone would find it so valuable?
What are the primary features of automatic resource leveling?
What are some of the primary leveling options?

Best Practice
If you consider using automatic Resource Leveling, consider a hybrid approach, which involves manual adjustment to workloads and automatic Resource Leveling.

If you are working with a coach, save and email them this file (10 - 3 Resource Leveling.mpp should look like Figure 26).
If are planning to apply to either MS Master Class certificate, archive this completed simulation file so that you can submit it for review.

Return to the Master Class Book and review the next section for this Activity.

Manage Resource Workloads Across Projects
In this section, we are going to share and manage resources across projects. In addition, we are going to automatically level resources across projects.
Review
Review the Content Link above on Sharing Resources. (jump to)

Sharing and Leveling Resources Across Projects Simulation (20 minutes)

Download *mpp files
To start this simulation, download the files below using the icon above and open them in Microsoft Project. Make sure your global settings in Project Options are correct and that you are using Microsoft Project 2019, 2021, or Microsoft 365 updated, for best results. Also, download the Status Presentation.pptx file from Activity 8, and open it in PowerPoint for this simulation.
Resource Pool.mpp
HR Project.mpp
Deployment Project.mpp
New Software Project.mpp
Before we start the simulation, review each of the files.
Notice that the Resource Pool.mpp has four resources but no tasks, and the other files have tasks but no resources. The file that you are using as the resource pool could be a current project. This file is designated as the resource pool .mpp file, but it is just a regular *.mpp file. There is not selection in Microsoft Project that makes it a resource pool file.
Review the following steps and Chart 15 in Figure 28 before doing the simulation.
Step1
The first step in the process to share resources across projects is to create the resource pool file. Again, the resource pool file is a regular Microsoft Project *.mpp file. There are no unique characteristics of this file. However, most people create a resource pool file and enter and define all of the resources in a Resource Sheet view.
Step 2
The Resource Pool.mpp file is going to be the resource pool in this simulation. To share those resources, select an existing project that you want to share the resources from the resource pool file, and then from the Resource tab, click the Resource Pool command and the Share Resources…command.
An individual project can still maintain its own local resources, but if there is a naming conflict, the defined resource in the pool should take precedence, or be used instead of the resource in the project.

Figure 27. Share Resources dialog box.
Step 3
To view workloads across projects, create a master project by opening a blank project file and then insert the projects that share resources into this file by going to the Project tab / Subproject command, checking Link to project, selecting the projects, and then clicking Insert.
Projects are always inserted as collapsed in order to save time loading and to prevent crashing. When a project is expanded, the rest of the data from that project is loaded into the master.
Projects can be inserted read-only or read/write. If you want to make changes in the master file, like leveling resources, changes you want to save back to the source projects, insert the projects as read/write.

Best practice
Designate a person to be in charge of the resource pool file and to keep it current. This is not a relational database, so it is necessary to train project managers in the process of sharing resources from this file.

Figure 28. Steps in sharing resources from a resource pool file.

Download as PDF
Let’s share resources for the first project together and then you can do the other two projects on your own.
With the Resource Pool.mpp file open, open or select the Deployment Project.
Share the resources from the resource pool by selecting the Resource tab, click the Resource Pool command and Share Resources… Select the Resource Pool.mpp and make sure the pool has precedence.
Then open the Assign Resources floating dialog box and assign all four resources at 100% to the three detail tasks as shown below.

Figure 29. Assigning multiple resources to multiple tasks using the Assign Resources dialog box.
Follow the same steps for the other two projects, HR Project and New Software Project.
When finished, save all three projects and close all projects including the resource pool.
Next, insert the three projects (not the resource pool) into a blank (Master) project as shown below.

Figure 30. Inserting projects into a master project.
When you click Insert, by default these projects are inserted into the master project as read/write. Place the projects in the same order on the screen below.
Expand each project. As you do this you will be asked to open the resource pool file so that resources can be viewed across the sharer files. Click OK.

Figure 31. Message asking to open the resource pool file so that assignments across projects can be seen.
After expanding the projects, it is easy to assume there are resource over allocations or conflicts since the projects overlap. Let’s look at some of these allocations.
Apply the Resource Graph view, split the window and show the Gantt Chart on the bottom. In the Gantt Chart view, insert the Project field so that you can identify which tasks (since the names are the same) are associated with which project.
It is easy to see that Alice, for instance, is overallocated. Select the Format tab on the ribbon and note the different graphs that are available.

Figure 32. Resource workloads across multiple projects in the master project.
Return to the Gantt Chart view without a split window and insert the Leveling Delay and Priority fields.
These resource over allocations can be resolved in the master project in the same way they are resolved in a project. Automatic Resource Leveling can also be used. If you use automatic Resource Leveling, we recommend using a hybrid approach as illustrated above.
If you use automatic Resource Leveling the Leveling Delay field will let you know in elapsed time how much a task is delayed by leveling. The Priority field allows you to give projects and tasks a priority ranking when leveling. The ranking is 0 to 1000, a 1000 ranking means that the task will not be leveled at all. A task with a ranking of 1, will be delayed before a task with a ranking or priority of 2.
Let’s give this a try. Give the Deployment Project a priority of 1000, make the same selections in Leveling Options as shown in the figure below, and then Level All.

Figure 33. Resource Leveling dialog box.
Obviously, you can apply a hybrid approach to this, but resource leveling across projects can go a long way in preventing bottlenecks in the traffic flow of project work in an organization.

Warning: Master projects and automatic resource leveling are restricted in scope by computing power. Do not assume these functions can be performed easily with more than a couple of dozen project files.

Figure 34. Master project showing leveling delays.
Close the master project and there is no reason to save any changes. A master project may be temporarily created for a specific purpose with no intent of using the file again. When closed, you will be asked if you want to save changes to the source projects including the resource pool file. Save only the changes to the software project and then do these three things:
Open the New Software Project.mpp and rename the file to 10 - 4 New Software Project.mpp. Disconnect this proejct from the resource pool file. Resource / Resource Pool / Share Resources / Use own resources. Notice, that you still keep the resources from the pool file that you assigned to tasks. A possible scenario might be one in which an individual in the organization maintains the resource pool files, and project managers use this file only when building their team of resources for a project. After assignments are made, they use their pool, unlinking to the resource pool file.
Apply the Leveling Gantt view to this project. This view clearly identifies the schedule results of automatic leveling.
Save the project.
Simulation Results
Your project should look like the one in the figure below. It is not attached to the resource pool file and it maintains the resources and leveling delay.

Figure 35. Disconnecting from the resource pool but maintaining the resources from the pool file.
This is the last application for Activity 10. Make your MS Project Master Class Plan.mpp is up to date, including entering how much time you spent on each detail task in the Timesheet column. Send this file to your coach if you have one, or archive it for a certificate if desired.

Journal
Do you currently manage multiple projects that share some of the same resources? If not, this feature set has limited value. However, if you work with a group of people who share the same projects, this could be invaluable. Typically, someone in the group manages the Resource Pool.mpp file and keeps it in the exact location. People in the group share those resources on their projects, and usually, someone manages the master project, weekly looking for problems across projects.
What are the three steps to setting up a way to manage resources across projects?

If you are working with a coach, send them the software project file (10 - 4 New Software Project.mpp should look like Figure 35).
If are planning to apply to either MS Master Class certificate, archive this completed simulation file so that you can submit it for review.

Return to the Master Class Book and review the next section for this Activity.

Review of Best Practices
Acquire Project Team Workflow
Get in the practice of thinking about the skills required for resource assignments. Then work to acquire a team that represents those skills.
A primary skill in project management is quickly leveling the cityscape of resource assignments. Resource workloads often look like a cityscape. The idea of resource leveling is to smooth that cityscape, eliminating the peaks and valleys.
Sharing Resources
Sharing resources and combining projects in a master project has some practical limitations. This feature is not an enterprise-type functionality and has a practical upper limit of a few dozen projects with a few hundred tasks each. But, on a small scale, an invaluable feature.
Resolving Resource Overallocations
Master the different types of views in Microsoft Project so that you can quickly switch from view to view to manage resources.
Resource Leveling
Think of resource leveling as playing a strategic game like chess. There are many moves you can make to accomplish your goal. Some sequences of moves are certainly better than others. In games like chess, you need to see the board in your head, and you need to be able to think ahead. It is the same in Microsoft Project. You have to see what is happening in the schedule as you make your moves, even though all of the data may not be available in the current view. The more you practice leveling resources, the better you will get.
Make notes of each move with a pen and pad as you make your moves to adjust the project to resolve resource workload issues.
As you make your moves to adjust the project to resolve resource workload issues, make notes of each move with a pen and pad.
Automatic Resource Leveling
If you consider using automatic Resource Leveling, consider a hybrid approach, which involves manual adjustment to workloads and automatic Resource Leveling.

Activity 10 Exam
Complete this Activity by taking this exam. Take the exam here.

Figure 36. Activity 10 Exam.
Simulation Files
MS Project Master Class Plan.mpp (Through this Activity, this project should include all of the activities, estimates of duration, you should be assigned at the appropriate amount of work, all of the activities are linked together with standard dependencies and should be scheduled appropriately. You should have a Must Finish on finish date for the last task and you should have a record of the time you have spent on each activity to date.)
10 - 1 Aquire Team Workflow.mpp (This file should have no resource overallocation.)
10 - 2 Acquire Team.mpp (This file should look like Figure 19)
10 - 3 Resource Leveling.mpp (This file should look like Figure 26)
10 - 4 New Software Project.mpp (This file should look like Figure 35)
Using Process Bridge? It’s easy to follow the workflow…

Figure 37. Process Bridge, Activity 10: Acquire Project Team
A - Acquire Project Team is under the Executing tab on the ribbon. Walk down this group to identify and resolve over allocations.
Views:
Resource - Apply the Resource view.
Workloads - Apply split window.
Leveling - Apply split window.
Leveling Gantt - Apply Leveling Gant chart view.
B - Step 10: Acquire Project Team floating bar. Walk down these commands to identify and resolve over allocations.
The floating bar contains all of the core leveling functionality.
Acquire Project Team Workflow
Resource Leveling Commands:
Build Team From Enterprise - Replacing generic resources with a team, if using Project Server.
Next Overallocation - Command moves to the next overallocation.
Leveling Option - Command opens Leveling Options dialog box.
Level All - Command uses the Leveling Options selected and levels all resources.
Level Resource - Command uses the Leveling Options selected and levels selected resources.
Level Selected - Command uses the Leveling Options selected and levels selected resources or tasks.
Clear All Leveling - Command clears all leveled resources.
Clear Leveling for Selected - Command clears leveling for selected resources or tasks.
Views:
Resource - Apply the Resource view.
Workloads - Apply split window.
Leveling - Apply split window.
Leveling Gantt - Apply Leveling Gant chart view.
Click the Acquire Project Team Workflow radio button to view the workflow for this activity.

Figure 38. Activity 10, Acquire Project Team workflow.
Click the Resource command to open the Resource Sheet view showing the total work assigned to the project for each resource and the most (Peak) a resource is assigned at any given time.

Figure 39. Resource Sheet view.
Click the Workload command to apply a split window with the Resource Graph view on top and the Resource Usage view on the bottom.
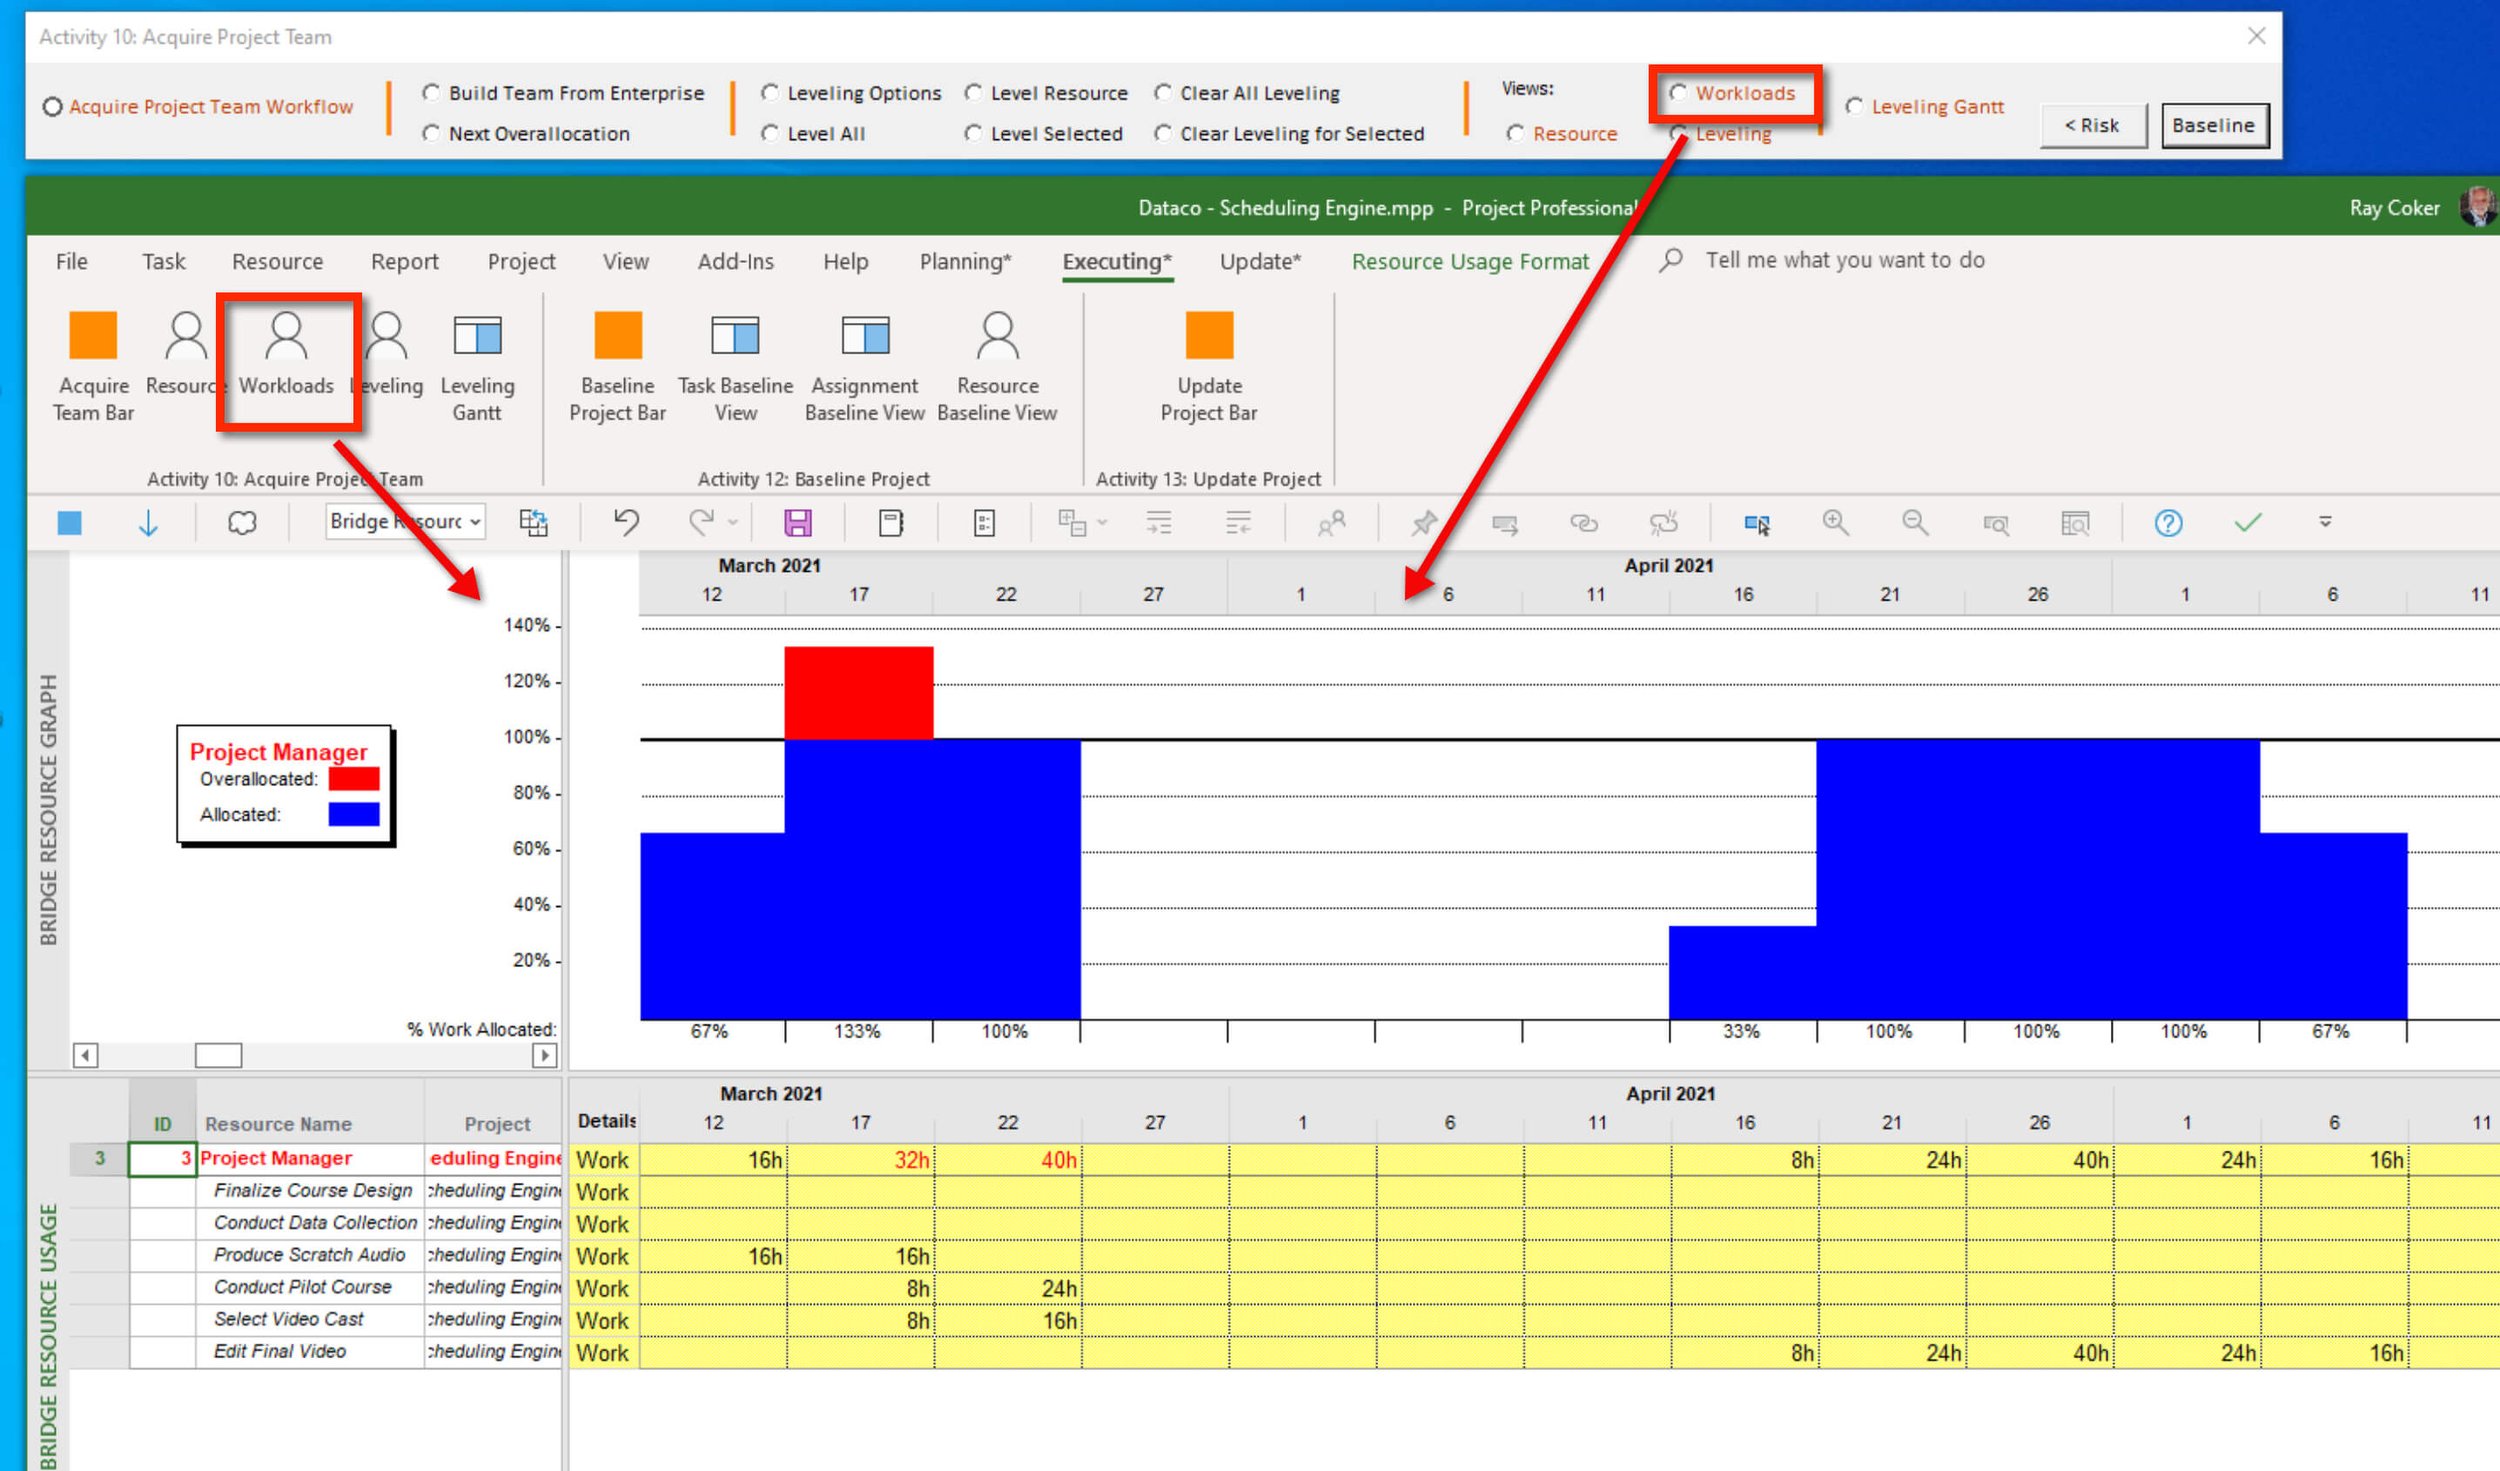
Figure 40. Split widow, Resource Graph on top, Resource Usage view on the bottom.
The Leveling command applies one of the more popular combination of views for resource leveling. The top view is the Resource Usage view and the bottom a Gantt Chart view.

Figure 41. Split window showing the Resource Usage view on the top and the Gantt Chart on the bottom.
If you are using automatic resource leveling, click the Leveling Gantt to view leveling changes.

Figure 42. Leveling Gantt view, showing the results of automatic resource leveling.